Estimated Value: $478,377 - $556,000
2
Beds
1
Bath
1,167
Sq Ft
$447/Sq Ft
Est. Value
About This Home
This home is located at 12974 Hibbard Rd, Lodi, CA 95240 and is currently estimated at $522,094, approximately $447 per square foot. 12974 Hibbard Rd is a home located in San Joaquin County with nearby schools including Lockeford Elementary School, Tokay High School, and Point Quest Central Valley.
Ownership History
Date
Name
Owned For
Owner Type
Purchase Details
Closed on
Jun 29, 2011
Sold by
Cowin Brandy
Bought by
Fernandez Rafael and Fernandez Norma
Current Estimated Value
Home Financials for this Owner
Home Financials are based on the most recent Mortgage that was taken out on this home.
Original Mortgage
$76,050
Outstanding Balance
$52,394
Interest Rate
4.54%
Mortgage Type
Unknown
Estimated Equity
$469,700
Purchase Details
Closed on
Apr 2, 2003
Sold by
Zepeda Juan V and Zepeda Marisela G
Bought by
Cowin Brandy
Home Financials for this Owner
Home Financials are based on the most recent Mortgage that was taken out on this home.
Original Mortgage
$200,000
Interest Rate
6.5%
Purchase Details
Closed on
Aug 18, 1999
Sold by
Rudnick Gary P and Rudnick Wanda L
Bought by
Zepeda Juan V and Zepeda Marisela G
Home Financials for this Owner
Home Financials are based on the most recent Mortgage that was taken out on this home.
Original Mortgage
$139,500
Interest Rate
7.63%
Create a Home Valuation Report for This Property
The Home Valuation Report is an in-depth analysis detailing your home's value as well as a comparison with similar homes in the area
Purchase History
| Date | Buyer | Sale Price | Title Company |
|---|---|---|---|
| Fernandez Rafael | $117,000 | Chicago Title Company | |
| Cowin Brandy | $250,000 | Alliance Title Co | |
| Zepeda Juan V | $139,500 | Old Republic Title Company |
Source: Public Records
Mortgage History
| Date | Status | Borrower | Loan Amount |
|---|---|---|---|
| Open | Fernandez Rafael | $76,050 | |
| Previous Owner | Cowin Brandy | $200,000 | |
| Previous Owner | Zepeda Juan V | $139,500 | |
| Closed | Cowin Brandy | $50,000 |
Source: Public Records
Tax History
| Year | Tax Paid | Tax Assessment Tax Assessment Total Assessment is a certain percentage of the fair market value that is determined by local assessors to be the total taxable value of land and additions on the property. | Land | Improvement |
|---|---|---|---|---|
| 2025 | $1,660 | $146,951 | $113,041 | $33,910 |
| 2024 | $1,615 | $144,071 | $110,825 | $33,246 |
| 2023 | $1,597 | $141,247 | $108,652 | $32,595 |
| 2022 | $1,556 | $138,478 | $106,522 | $31,956 |
| 2021 | $1,582 | $135,764 | $104,434 | $31,330 |
| 2020 | $1,541 | $134,373 | $103,364 | $31,009 |
| 2019 | $1,511 | $131,739 | $101,338 | $30,401 |
| 2018 | $1,490 | $129,156 | $99,351 | $29,805 |
| 2017 | $1,457 | $126,624 | $97,403 | $29,221 |
| 2016 | $1,367 | $124,141 | $95,493 | $28,648 |
| 2014 | $1,342 | $119,882 | $92,217 | $27,665 |
Source: Public Records
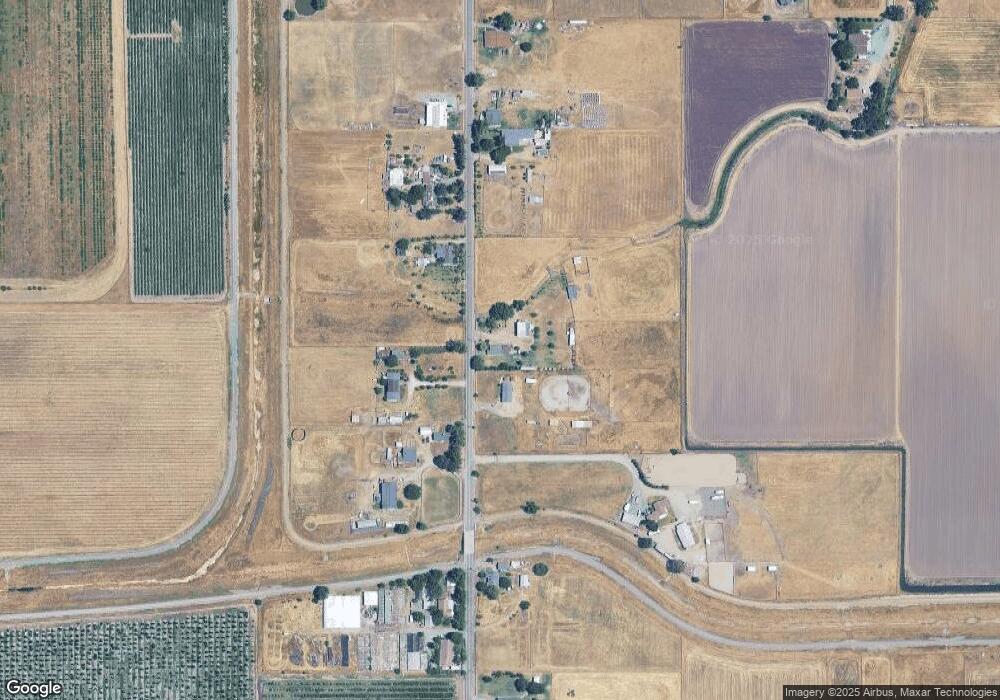
Map
Nearby Homes
- 13400 Hibbard Rd
- 11551 E Tokay Colony Rd
- 12860 E Tokay Colony Rd
- 12750 E Live Oak Rd
- 10400 E Harney Ln
- 18450 N Highway 88 Unit 29
- 15296 N Highway 88
- 19542 N Jack Tone Rd
- 11850 Live Oak Rd
- 15155 N Curry Ave
- 15942 N Jack Tone Rd
- 17036 N Locust Tree Rd
- 16464 Fox Rd
- 15910 N Locust Tree Rd
- 16025 E Harney Ln
- 12116 Alpine Rd
- 11791 N Alpine Rd
- 7782 E Harney Ln
- 17010 N Locust Tree Rd
- 17266 Hillside Dr
- 12920 Hibbard Rd
- 12905 Hibbard Rd
- 13131 Hibbard Rd
- 12857 Hibbard Rd
- 13166 Hibbard Rd
- 12767 Hibbard Rd
- 13207 Hibbard Rd
- 12773 Hibbard Rd
- 12850 Hibbard Rd
- 13188 Hibbard Rd
- 12700 Hibbard Rd
- 12486 E Harney Ln
- 12650 Hibbard Rd
- 13341 Hibbard Rd
- 12502 E Harney Ln
- 12594 Hibbard Rd
- 12591 Hibbard Rd
- 12270 E Harney Ln
- 12550 Hibbard Rd
- 12150 E Harney Ln
Your Personal Tour Guide
Ask me questions while you tour the home.