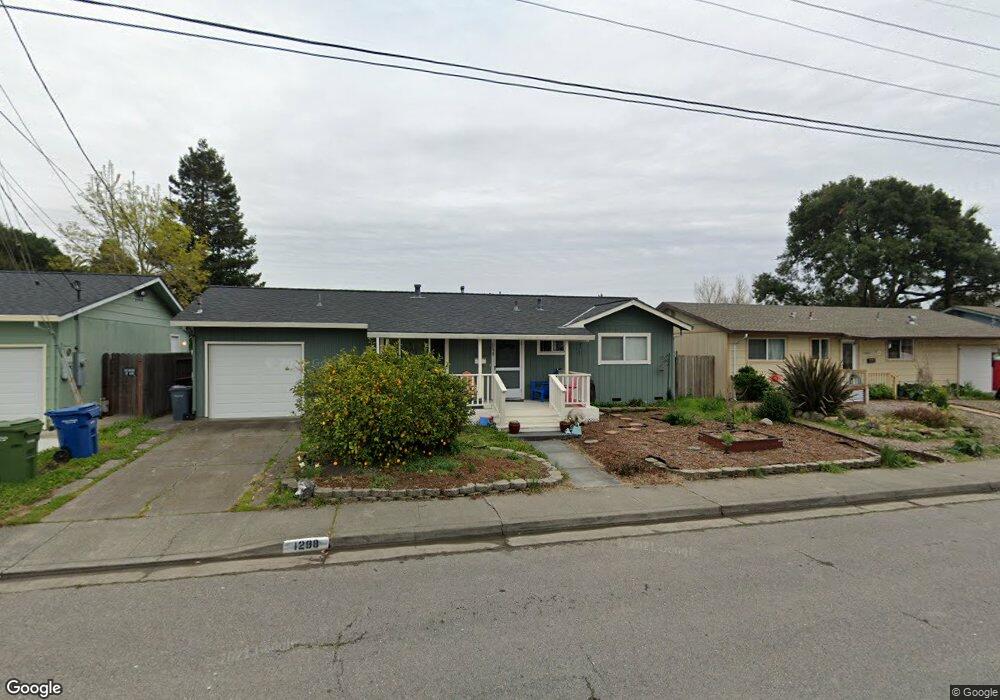
1298 Marian Way Petaluma, CA 94954
Adobe NeighborhoodEstimated Value: $681,000 - $768,000
3
Beds
1
Bath
1,224
Sq Ft
$583/Sq Ft
Est. Value
About This Home
This home is located at 1298 Marian Way, Petaluma, CA 94954 and is currently estimated at $713,366, approximately $582 per square foot. 1298 Marian Way is a home located in Sonoma County with nearby schools including McDowell Elementary School, Petaluma Junior High School, and Petaluma High School.
Ownership History
Date
Name
Owned For
Owner Type
Purchase Details
Closed on
Jun 20, 2016
Sold by
Keaton Kathleen
Bought by
Keaton Kathleen and The 2016 Kathleen J Keaton Rev
Current Estimated Value
Purchase Details
Closed on
Jun 16, 2003
Sold by
Lightell David A and Keaton Kathleen
Bought by
Keaton Kathleen
Home Financials for this Owner
Home Financials are based on the most recent Mortgage that was taken out on this home.
Original Mortgage
$152,000
Outstanding Balance
$64,599
Interest Rate
5.37%
Mortgage Type
Purchase Money Mortgage
Estimated Equity
$648,767
Purchase Details
Closed on
May 16, 1995
Sold by
Lightell Kathleen K and Keaton Kathleen J
Bought by
Lightell David A and Lightell Kathleen K
Home Financials for this Owner
Home Financials are based on the most recent Mortgage that was taken out on this home.
Original Mortgage
$151,300
Interest Rate
8.51%
Purchase Details
Closed on
Sep 14, 1989
Bought by
Keaton Kathleen Tr
Create a Home Valuation Report for This Property
The Home Valuation Report is an in-depth analysis detailing your home's value as well as a comparison with similar homes in the area
Home Values in the Area
Average Home Value in this Area
Purchase History
| Date | Buyer | Sale Price | Title Company |
|---|---|---|---|
| Keaton Kathleen | -- | None Available | |
| Keaton Kathleen | -- | Fidelity Natl Title Co | |
| Lightell David A | $90,500 | First American Title | |
| Keaton Kathleen Tr | $152,500 | -- |
Source: Public Records
Mortgage History
| Date | Status | Borrower | Loan Amount |
|---|---|---|---|
| Open | Keaton Kathleen | $152,000 | |
| Closed | Lightell David A | $151,300 |
Source: Public Records
Tax History Compared to Growth
Tax History
| Year | Tax Paid | Tax Assessment Tax Assessment Total Assessment is a certain percentage of the fair market value that is determined by local assessors to be the total taxable value of land and additions on the property. | Land | Improvement |
|---|---|---|---|---|
| 2025 | $3,316 | $300,328 | $147,173 | $153,155 |
| 2024 | $3,316 | $294,440 | $144,288 | $150,152 |
| 2023 | $3,316 | $288,667 | $141,459 | $147,208 |
| 2022 | $3,162 | $283,008 | $138,686 | $144,322 |
| 2021 | $3,102 | $277,460 | $135,967 | $141,493 |
| 2020 | $3,128 | $274,616 | $134,573 | $140,043 |
| 2019 | $3,089 | $269,233 | $131,935 | $137,298 |
| 2018 | $3,076 | $263,955 | $129,349 | $134,606 |
| 2017 | $3,012 | $258,780 | $126,813 | $131,967 |
| 2016 | $2,935 | $253,707 | $124,327 | $129,380 |
| 2015 | $2,894 | $249,897 | $122,460 | $127,437 |
| 2014 | $2,879 | $245,003 | $120,062 | $124,941 |
Source: Public Records
Map
Nearby Homes
- 637 Saint Francis Dr
- 1293 Pacific Ave
- 1312 Glenwood Dr
- 29 Alta Dr
- 1303 Ponderosa Dr
- 840 Sprucewood Ct
- 73 Alta Dr
- 1108 Gumwood Ln
- 844 Cedarwood Ln
- 228 S Mcdowell Blvd
- 1513 Elizabeth Dr
- 1821 Lakeville Hwy Unit 77
- 1688 Kearny Ct
- 642 Albert Way
- 1711 Capistrano Dr
- 0 Lakeville St
- 1705 Clairmont Ct
- 1627 Juliet Dr
- 1638 Lauren Dr
- 1313 Saint Francis Dr