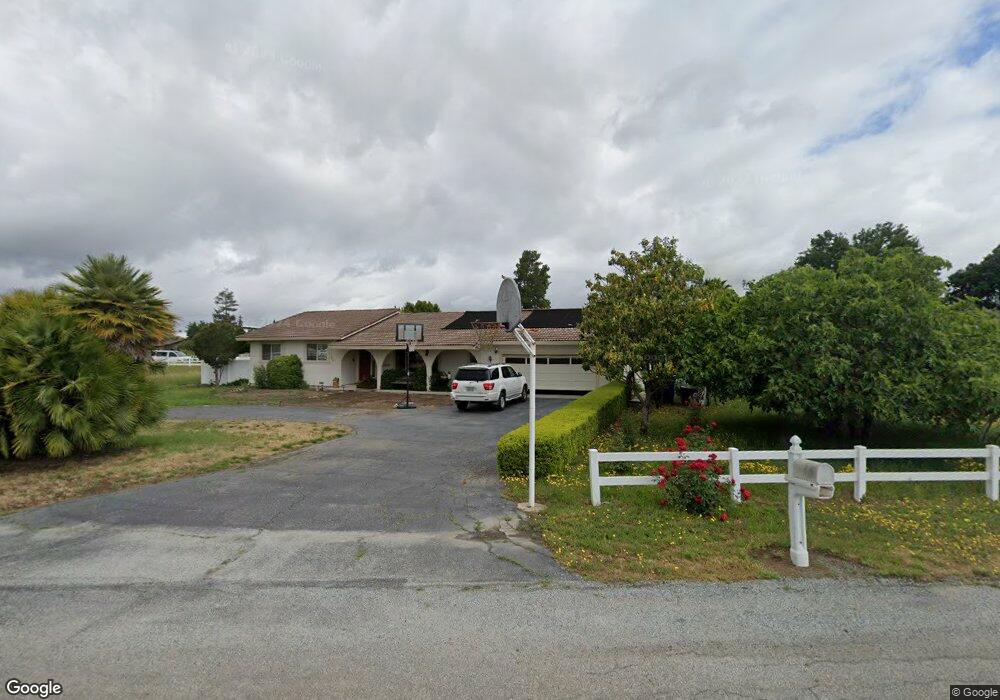
12980 Moreno Ct San Martin, CA 95046
Estimated Value: $1,187,000 - $1,423,432
3
Beds
2
Baths
2,178
Sq Ft
$622/Sq Ft
Est. Value
About This Home
This home is located at 12980 Moreno Ct, San Martin, CA 95046 and is currently estimated at $1,355,108, approximately $622 per square foot. 12980 Moreno Ct is a home located in Santa Clara County with nearby schools including San Martin/Gwinn Environmental Science Academy, Britton Middle School, and Live Oak High School.
Ownership History
Date
Name
Owned For
Owner Type
Purchase Details
Closed on
Sep 23, 1994
Sold by
Kjellsen James Dean and Kjellsen Susana Supnet
Bought by
Kjellsen James Dean and Kjellsen Susana Supnet
Current Estimated Value
Home Financials for this Owner
Home Financials are based on the most recent Mortgage that was taken out on this home.
Original Mortgage
$223,500
Interest Rate
8.8%
Mortgage Type
Purchase Money Mortgage
Purchase Details
Closed on
Aug 18, 1994
Sold by
Kjellsen James Dean and Kjellsen Susan Supnet
Bought by
Kjellsen James Dean and Kjellsen Susana Supnet
Home Financials for this Owner
Home Financials are based on the most recent Mortgage that was taken out on this home.
Original Mortgage
$223,500
Interest Rate
8.8%
Mortgage Type
Purchase Money Mortgage
Purchase Details
Closed on
Jul 20, 1993
Sold by
Kjellsen James Dean and Kjellsen Susana Supnet
Bought by
Kjellsen James Dean and Kjellsen Susana Supnet
Create a Home Valuation Report for This Property
The Home Valuation Report is an in-depth analysis detailing your home's value as well as a comparison with similar homes in the area
Home Values in the Area
Average Home Value in this Area
Purchase History
| Date | Buyer | Sale Price | Title Company |
|---|---|---|---|
| Kjellsen James Dean | -- | -- | |
| Kjellsen James Dean | -- | Old Republic Title Company | |
| Kjellsen James Dean | -- | -- |
Source: Public Records
Mortgage History
| Date | Status | Borrower | Loan Amount |
|---|---|---|---|
| Closed | Kjellsen James Dean | $223,500 |
Source: Public Records
Tax History Compared to Growth
Tax History
| Year | Tax Paid | Tax Assessment Tax Assessment Total Assessment is a certain percentage of the fair market value that is determined by local assessors to be the total taxable value of land and additions on the property. | Land | Improvement |
|---|---|---|---|---|
| 2025 | $5,466 | $484,157 | $165,932 | $318,225 |
| 2024 | $5,466 | $474,665 | $162,679 | $311,986 |
| 2023 | $5,395 | $465,359 | $159,490 | $305,869 |
| 2022 | $5,302 | $456,235 | $156,363 | $299,872 |
| 2021 | $5,168 | $447,291 | $153,298 | $293,993 |
| 2020 | $5,044 | $442,706 | $151,727 | $290,979 |
| 2019 | $5,183 | $434,026 | $148,752 | $285,274 |
| 2018 | $5,196 | $425,517 | $145,836 | $279,681 |
| 2017 | $5,145 | $417,175 | $142,977 | $274,198 |
| 2016 | $4,816 | $408,996 | $140,174 | $268,822 |
| 2015 | $4,764 | $402,854 | $138,069 | $264,785 |
| 2014 | $4,819 | $394,964 | $135,365 | $259,599 |
Source: Public Records
Map
Nearby Homes
- 905 E San Martin Ave
- 13035 Center Ave
- 13640 Sycamore Ave
- 13705 Sycamore Ave
- 12550 Center Ave
- 13755 Columbet Ave
- 13690 Murphy Ave #E
- 0 W San Martin Ave
- 30 Chester Ave
- 0 Llagas Ave Unit ML82019140
- 12645 Harding Ave
- 12320 Highland Estates Ln
- 2115 Gwinn Ave
- 12467 Creekview Ct
- 11840 Foothill Ave
- 1925 Church Ave
- 12315 Harding Ave
- 14325 Monterey Rd
- 475 E Middle Ave
- 12755 Santa Teresa Blvd
- 12990 Sycamore Ave
- 12970 Moreno Ct
- 12940 Moreno Ct
- 13005 Sycamore Ave
- 12985 Sycamore Ave
- 12950 Moreno Ct
- 12965 Sycamore Ave
- 12945 Sycamore Ave
- 12960 Moreno Ct
- 13065 Sycamore Ave
- 12860 Sycamore Ave
- 12850 Sycamore Ave
- 12855 Sycamore Ave
- 12800 Sycamore Ave
- 12820 Sycamore Ave
- 12835 Columbet Ave
- 12765 Sycamore Ave
- 12770 Sycamore Ave
- 12935 Columbet Ave
- 13005 Columbet Ave