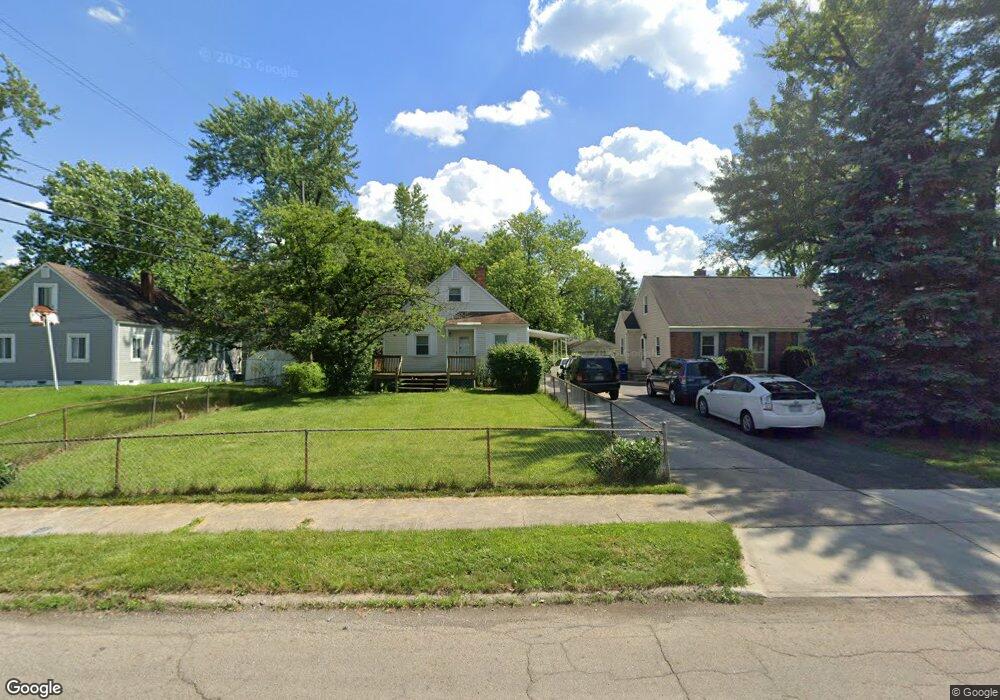
1299 E North Broadway St Columbus, OH 43224
North Linden NeighborhoodEstimated Value: $201,000 - $214,000
3
Beds
1
Bath
1,106
Sq Ft
$187/Sq Ft
Est. Value
About This Home
This home is located at 1299 E North Broadway St, Columbus, OH 43224 and is currently estimated at $207,117, approximately $187 per square foot. 1299 E North Broadway St is a home located in Franklin County with nearby schools including Huy Elementary School, Medina Middle School, and Mifflin High School.
Ownership History
Date
Name
Owned For
Owner Type
Purchase Details
Closed on
Aug 16, 2023
Sold by
Means Paula J
Bought by
Peregrina Gabriel J
Current Estimated Value
Home Financials for this Owner
Home Financials are based on the most recent Mortgage that was taken out on this home.
Original Mortgage
$203,603
Outstanding Balance
$198,964
Interest Rate
6.81%
Mortgage Type
New Conventional
Estimated Equity
$8,153
Purchase Details
Closed on
Feb 28, 2012
Sold by
Whitman Steven H
Bought by
Whitman Paula J and Reiss Paula J
Purchase Details
Closed on
Jan 30, 2003
Sold by
Reis Paula J and Reis Paula J
Bought by
Whitman Steven H and Whitman Paula J
Home Financials for this Owner
Home Financials are based on the most recent Mortgage that was taken out on this home.
Original Mortgage
$67,200
Interest Rate
5.3%
Mortgage Type
Purchase Money Mortgage
Purchase Details
Closed on
Jun 3, 1991
Bought by
Reis Paula J
Purchase Details
Closed on
Dec 1, 1985
Create a Home Valuation Report for This Property
The Home Valuation Report is an in-depth analysis detailing your home's value as well as a comparison with similar homes in the area
Home Values in the Area
Average Home Value in this Area
Purchase History
| Date | Buyer | Sale Price | Title Company |
|---|---|---|---|
| Peregrina Gabriel J | $209,900 | Northwest Advantage Title Agen | |
| Whitman Paula J | -- | Attorney | |
| Whitman Steven H | -- | Lawyers Title | |
| Reis Paula J | $55,900 | -- | |
| -- | $46,000 | -- |
Source: Public Records
Mortgage History
| Date | Status | Borrower | Loan Amount |
|---|---|---|---|
| Open | Peregrina Gabriel J | $203,603 | |
| Previous Owner | Whitman Steven H | $67,200 |
Source: Public Records
Tax History Compared to Growth
Tax History
| Year | Tax Paid | Tax Assessment Tax Assessment Total Assessment is a certain percentage of the fair market value that is determined by local assessors to be the total taxable value of land and additions on the property. | Land | Improvement |
|---|---|---|---|---|
| 2024 | $2,243 | $49,980 | $11,900 | $38,080 |
| 2023 | $2,214 | $49,980 | $11,900 | $38,080 |
| 2022 | $1,547 | $29,820 | $6,300 | $23,520 |
| 2021 | $1,549 | $29,820 | $6,300 | $23,520 |
| 2020 | $1,551 | $29,820 | $6,300 | $23,520 |
| 2019 | $1,478 | $24,360 | $5,250 | $19,110 |
| 2018 | $1,392 | $24,360 | $5,250 | $19,110 |
| 2017 | $1,460 | $24,360 | $5,250 | $19,110 |
| 2016 | $1,443 | $21,780 | $3,260 | $18,520 |
| 2015 | $1,310 | $21,780 | $3,260 | $18,520 |
| 2014 | $1,313 | $21,780 | $3,260 | $18,520 |
| 2013 | $761 | $25,585 | $3,815 | $21,770 |
Source: Public Records
Map
Nearby Homes
- 3107 Hamilton Ave
- 3071 Karl Rd
- 3129 McGuffey Rd
- 1247 Weldon Ave
- 2981 Gerbert Rd
- 3268 McGuffey Rd
- 1225 Sandlin Ave
- 3056 Medina Ave
- 3134 Medina Ave
- 2916 Hamilton Ave
- 2913 Gerbert Rd
- 2905 Ontario St
- 2950 Grasmere Ave
- 3105 Atwood Terrace
- 3352 Karl Rd
- 3131 Dresden St
- 2890 Medina Ave
- 3058 Dresden St
- 2996 Atwood Terrace
- 1270 Urana Ave
- 1293 E North Broadway St
- 3115 Hamilton Ave
- 3100 Karl Rd
- 3099 Hamilton Ave
- 1279 E North Broadway St
- 3096 Karl Rd
- 3102 Karl Rd
- 1273 E North Broadway St
- 3139 Hamilton Ave
- 3114 Hamilton Ave
- 3106 Hamilton Ave
- 1304 E North Broadway St
- 1296 E North Broadway St
- 3092 Karl Rd
- 3104 Karl Rd
- 3098 Hamilton Ave
- 3085 Hamilton Ave
- 1290 E North Broadway St
- 3106 Karl Rd
- 1284 E North Broadway St