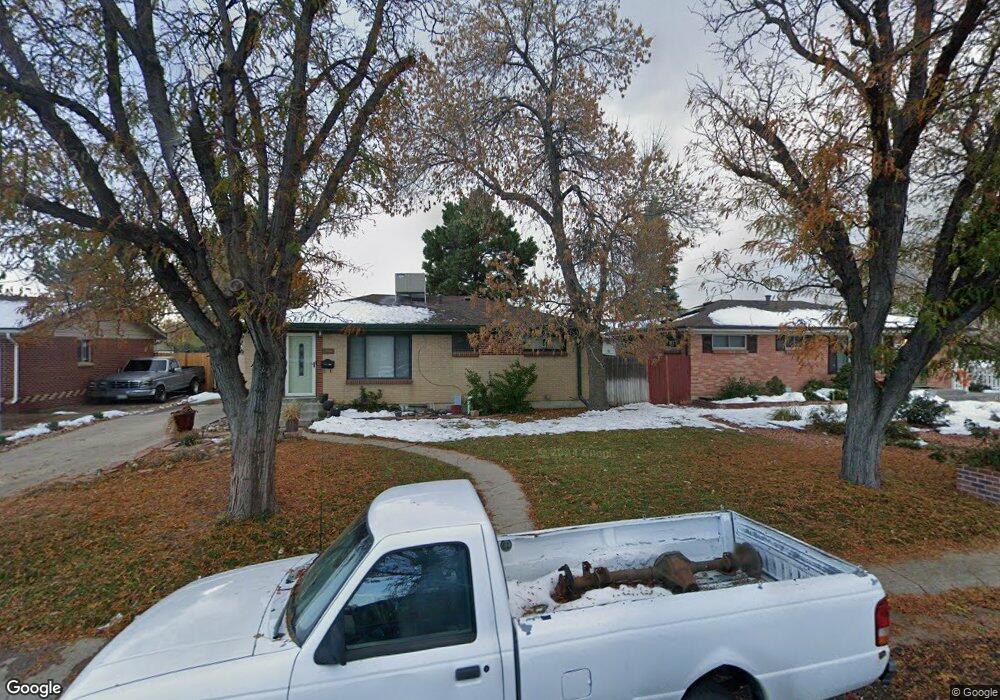
12996 E 30th Ave Aurora, CO 80011
Morris Heights NeighborhoodEstimated Value: $364,235 - $443,000
3
Beds
1
Bath
950
Sq Ft
$426/Sq Ft
Est. Value
About This Home
This home is located at 12996 E 30th Ave, Aurora, CO 80011 and is currently estimated at $404,809, approximately $426 per square foot. 12996 E 30th Ave is a home located in Adams County with nearby schools including Park Lane Elementary School, North Middle School Health Sciences & Technology, and Hinkley High School.
Ownership History
Date
Name
Owned For
Owner Type
Purchase Details
Closed on
Jul 24, 2018
Sold by
Flynn Shad M
Bought by
Flynn Karen R
Current Estimated Value
Home Financials for this Owner
Home Financials are based on the most recent Mortgage that was taken out on this home.
Original Mortgage
$181,000
Outstanding Balance
$155,873
Interest Rate
4.5%
Mortgage Type
New Conventional
Estimated Equity
$248,936
Purchase Details
Closed on
Nov 22, 1995
Sold by
Jones Clyde M and Jones Jamie
Bought by
Flynn Shad M and Flynn Karen R
Home Financials for this Owner
Home Financials are based on the most recent Mortgage that was taken out on this home.
Original Mortgage
$92,838
Interest Rate
7.36%
Mortgage Type
FHA
Purchase Details
Closed on
Sep 2, 1993
Sold by
Fletcher Patricia
Bought by
Jones Clyde M and Jones Jamie
Home Financials for this Owner
Home Financials are based on the most recent Mortgage that was taken out on this home.
Original Mortgage
$64,890
Interest Rate
7.23%
Mortgage Type
FHA
Create a Home Valuation Report for This Property
The Home Valuation Report is an in-depth analysis detailing your home's value as well as a comparison with similar homes in the area
Home Values in the Area
Average Home Value in this Area
Purchase History
| Date | Buyer | Sale Price | Title Company |
|---|---|---|---|
| Flynn Karen R | -- | None Available | |
| Flynn Shad M | $93,500 | -- | |
| Jones Clyde M | $68,500 | -- |
Source: Public Records
Mortgage History
| Date | Status | Borrower | Loan Amount |
|---|---|---|---|
| Open | Flynn Karen R | $181,000 | |
| Closed | Flynn Shad M | $92,838 | |
| Previous Owner | Jones Clyde M | $64,890 |
Source: Public Records
Tax History
| Year | Tax Paid | Tax Assessment Tax Assessment Total Assessment is a certain percentage of the fair market value that is determined by local assessors to be the total taxable value of land and additions on the property. | Land | Improvement |
|---|---|---|---|---|
| 2025 | $2,454 | $27,400 | $5,780 | $21,620 |
| 2024 | $2,454 | $25,190 | $5,310 | $19,880 |
| 2023 | $2,494 | $27,130 | $5,750 | $21,380 |
| 2022 | $2,518 | $22,160 | $5,490 | $16,670 |
| 2021 | $2,623 | $22,160 | $5,490 | $16,670 |
| 2020 | $2,692 | $22,810 | $5,650 | $17,160 |
| 2019 | $2,687 | $22,810 | $5,650 | $17,160 |
| 2018 | $2,054 | $17,360 | $5,040 | $12,320 |
| 2017 | $1,824 | $17,360 | $5,040 | $12,320 |
| 2016 | $1,240 | $11,700 | $2,590 | $9,110 |
| 2015 | $1,201 | $11,700 | $2,590 | $9,110 |
| 2014 | $985 | $9,450 | $2,150 | $7,300 |
Source: Public Records
Map
Nearby Homes
- 3123 Uvalda St
- 3090 Worchester St
- 3131 Xanadu St
- 3206 Vaughn St
- 3219 Uvalda St
- 3065 Zion St
- 3008 Zion St
- 2507 Zion St
- 3222 Blackhawk Cir
- 3055 Carson St
- 2671 Sable Blvd
- 2381 Oswego St
- 2621 Sable Blvd
- 14280 E 22nd Place
- 2381 Nome St
- 1957 Blackhawk St
- 1959 Blackhawk St
- 11589 E 25th Dr
- 1953 Blackhawk St
- 2522 Moline St
- 12986 E 30th Ave
- 13008 E 30th Ave
- 13038 E 30th Ave
- 3001 Ursula St
- 13068 E 30th Ave
- 3000 Ursula St
- 13098 E 30th Ave
- 3009 Ursula St
- 3008 Ursula St
- 3003 Uvalda St
- 12956 E 30th Ave
- 13110 E 30th Ave
- 3017 Ursula St
- 3016 Ursula St
- 3011 Uvalda St
- 12946 E 30th Ave
- 13130 E 30th Ave
- 3025 Ursula St
- 3024 Ursula St
- 3019 Uvalda St
Your Personal Tour Guide
Ask me questions while you tour the home.