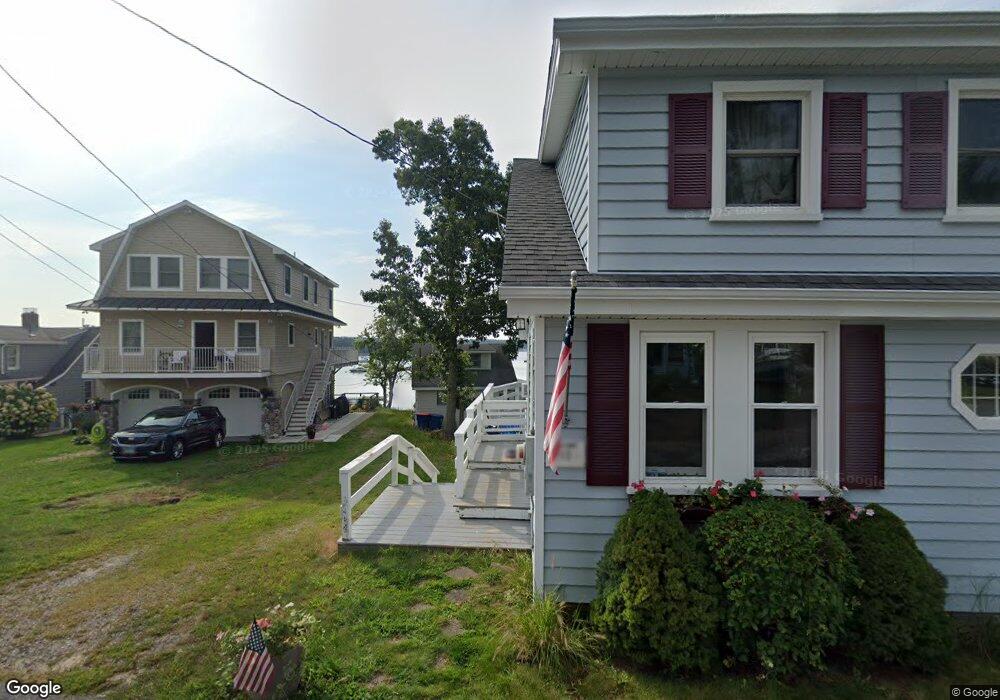
12B Barnacle Rd Wareham, MA 02571
Wareham Center NeighborhoodEstimated Value: $466,000 - $508,000
3
Beds
1
Bath
918
Sq Ft
$539/Sq Ft
Est. Value
About This Home
This home is located at 12B Barnacle Rd, Wareham, MA 02571 and is currently estimated at $495,250, approximately $539 per square foot. 12B Barnacle Rd is a home located in Plymouth County.
Ownership History
Date
Name
Owned For
Owner Type
Purchase Details
Closed on
Aug 13, 2025
Sold by
Drago Joseph
Bought by
Barnaele Rd Rt and Drago
Current Estimated Value
Purchase Details
Closed on
Aug 9, 2023
Sold by
Odriscoll Rt and Odriscoll
Bought by
Drago Joseph
Purchase Details
Closed on
Jan 3, 2011
Sold by
Odriscoll Frederick T
Bought by
Odriscoll Rt and Odriscoll
Purchase Details
Closed on
Sep 8, 2009
Sold by
Odriscoll Frederick T and Odriscoll Frederick T
Bought by
Odriscoll Frederick T
Home Financials for this Owner
Home Financials are based on the most recent Mortgage that was taken out on this home.
Original Mortgage
$65,000
Interest Rate
5.21%
Mortgage Type
Purchase Money Mortgage
Create a Home Valuation Report for This Property
The Home Valuation Report is an in-depth analysis detailing your home's value as well as a comparison with similar homes in the area
Home Values in the Area
Average Home Value in this Area
Purchase History
| Date | Buyer | Sale Price | Title Company |
|---|---|---|---|
| Barnaele Rd Rt | -- | -- | |
| Barnaele Rd Rt | -- | -- | |
| Drago Joseph | $405,000 | None Available | |
| Drago Joseph | $405,000 | None Available | |
| Odriscoll Rt | -- | -- | |
| Odriscoll Rt | -- | -- | |
| Odriscoll Frederick T | -- | -- | |
| Odriscoll Frederick T | -- | -- |
Source: Public Records
Mortgage History
| Date | Status | Borrower | Loan Amount |
|---|---|---|---|
| Previous Owner | Odriscoll Frederick T | $25,000 | |
| Previous Owner | Odriscoll Frederick T | $65,000 |
Source: Public Records
Tax History
| Year | Tax Paid | Tax Assessment Tax Assessment Total Assessment is a certain percentage of the fair market value that is determined by local assessors to be the total taxable value of land and additions on the property. | Land | Improvement |
|---|---|---|---|---|
| 2025 | $4,750 | $455,900 | $258,700 | $197,200 |
| 2024 | $4,200 | $374,000 | $192,600 | $181,400 |
| 2023 | $4,094 | $340,300 | $175,200 | $165,100 |
| 2022 | $4,004 | $303,800 | $175,200 | $128,600 |
| 2021 | $3,841 | $285,600 | $175,200 | $110,400 |
| 2020 | $3,723 | $280,800 | $175,200 | $105,600 |
| 2019 | $3,268 | $245,900 | $145,000 | $100,900 |
| 2018 | $3,144 | $230,700 | $145,000 | $85,700 |
| 2017 | $3,141 | $233,500 | $145,000 | $88,500 |
| 2016 | $2,936 | $217,000 | $138,300 | $78,700 |
| 2015 | $2,810 | $215,000 | $138,300 | $76,700 |
| 2014 | $2,702 | $210,300 | $128,900 | $81,400 |
Source: Public Records
Map
Nearby Homes
- 1 Nimrod Way
- 10 Oak St
- 15 Broadmarsh Ave
- 6 Allen Ave
- 20 Grant St
- 43 Shore Ave
- 12 Oakdale St
- 21 Bayview St
- 10 Barnes St
- 10 Longmeadow Dr
- 6 Bourne Terrace
- 110 Mayflower Ridge Dr
- 58 Shady Ln
- 437 Main St
- 233 Marion Rd
- 156 Sandwich Rd
- 2697 Cranberry Hwy Unit 21
- 2743 Cranberry Hwy Unit 5D
- 7 Cranberry Ln
- 2645 Cranberry Hwy Unit A
Your Personal Tour Guide
Ask me questions while you tour the home.