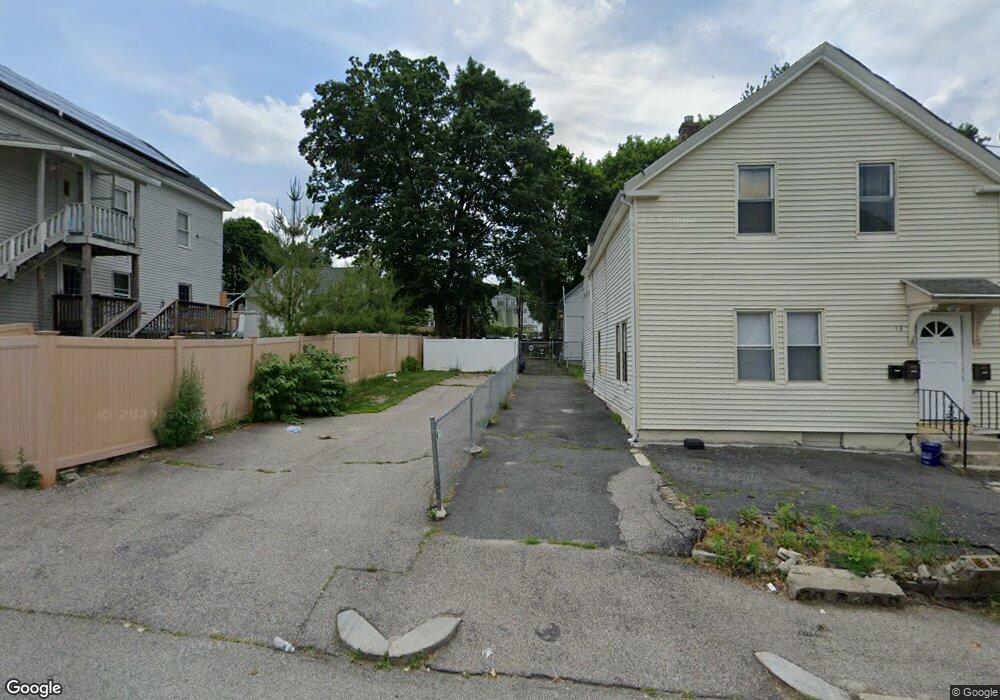
13 1/2 Bluff St Worcester, MA 01610
University Park NeighborhoodEstimated Value: $328,000 - $441,000
3
Beds
2
Baths
1,288
Sq Ft
$288/Sq Ft
Est. Value
About This Home
This home is located at 13 1/2 Bluff St, Worcester, MA 01610 and is currently estimated at $370,632, approximately $287 per square foot. 13 1/2 Bluff St is a home located in Worcester County with nearby schools including Jacob Hiatt Magnet School, Chandler Magnet, and Woodland Academy.
Ownership History
Date
Name
Owned For
Owner Type
Purchase Details
Closed on
May 5, 2005
Sold by
Barron David H
Bought by
Barron David H and Barron Mary J
Current Estimated Value
Create a Home Valuation Report for This Property
The Home Valuation Report is an in-depth analysis detailing your home's value as well as a comparison with similar homes in the area
Home Values in the Area
Average Home Value in this Area
Purchase History
| Date | Buyer | Sale Price | Title Company |
|---|---|---|---|
| Barron David H | -- | -- | |
| Barron David H | -- | -- |
Source: Public Records
Tax History
| Year | Tax Paid | Tax Assessment Tax Assessment Total Assessment is a certain percentage of the fair market value that is determined by local assessors to be the total taxable value of land and additions on the property. | Land | Improvement |
|---|---|---|---|---|
| 2025 | $3,626 | $274,900 | $76,300 | $198,600 |
| 2024 | $3,506 | $255,000 | $76,300 | $178,700 |
| 2023 | $3,305 | $230,500 | $61,300 | $169,200 |
| 2022 | $3,062 | $201,300 | $49,000 | $152,300 |
| 2021 | $2,926 | $179,700 | $39,200 | $140,500 |
| 2020 | $2,780 | $163,500 | $39,300 | $124,200 |
| 2019 | $2,734 | $151,900 | $38,800 | $113,100 |
| 2018 | $2,729 | $144,300 | $38,800 | $105,500 |
| 2017 | $2,612 | $135,900 | $38,800 | $97,100 |
| 2016 | $2,653 | $128,700 | $30,800 | $97,900 |
| 2015 | $2,583 | $128,700 | $30,800 | $97,900 |
| 2014 | $2,515 | $128,700 | $30,800 | $97,900 |
Source: Public Records
Map
Nearby Homes
- 13-1/2 Bluff St
- 4 Hollywood St Unit 4-3
- 15 Bluff St
- 13 Bluff St
- 13 Bluff St Unit 1
- 13 Bluff St Unit 2
- 9 Bluff St
- 8 Hollywood St
- 17 Bluff St
- 21 Bancroft St
- 5 Hollywood St
- 7 Bluff St Unit 1
- 7 Bluff St Unit 3
- 19 Bancroft St
- 23 Bancroft St Unit 2
- 23 Bancroft St Unit 3
- 9 Hollywood St
- 10 Bluff St
- 17 Bancroft St Unit 3
- 17 Bancroft St
Your Personal Tour Guide
Ask me questions while you tour the home.