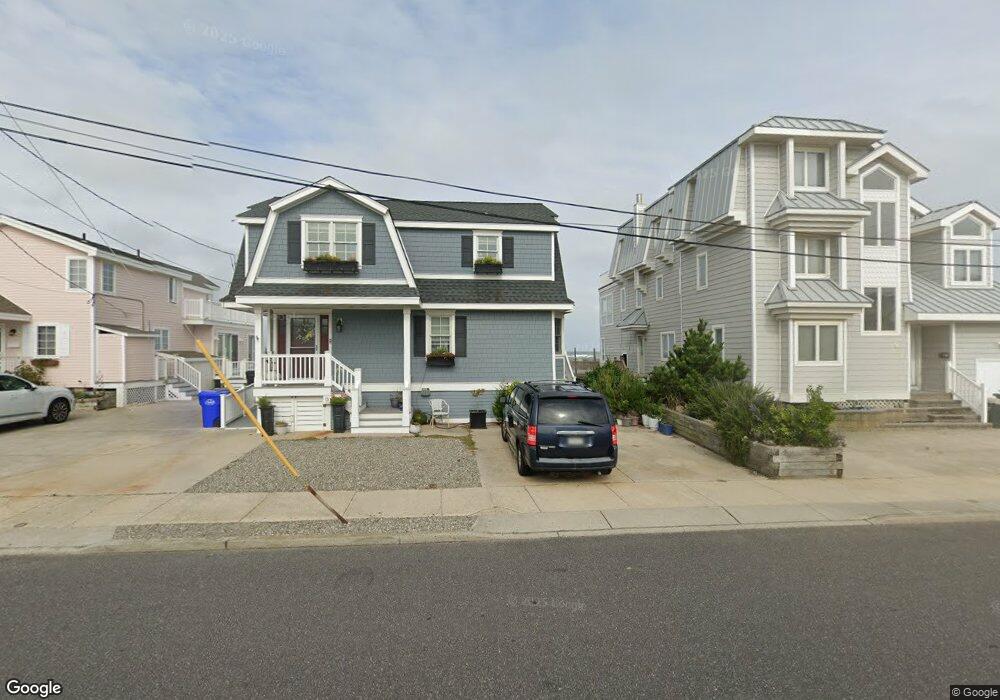
13 8th St W Avalon, NJ 08202
Estimated Value: $3,442,000 - $5,461,000
--
Bed
--
Bath
1,962
Sq Ft
$2,122/Sq Ft
Est. Value
About This Home
This home is located at 13 8th St W, Avalon, NJ 08202 and is currently estimated at $4,163,866, approximately $2,122 per square foot. 13 8th St W is a home located in Cape May County with nearby schools including Avalon Elementary School.
Ownership History
Date
Name
Owned For
Owner Type
Purchase Details
Closed on
Jan 8, 2013
Sold by
Stump Ronald B and Stump Carol Anne
Bought by
Ronald B Stump Shore House Irrevocable Reside and Carol A Stump Shore House Irrevocable Residen
Current Estimated Value
Purchase Details
Closed on
Oct 10, 1991
Sold by
Blumenstein Robert and Blumenstein Marilyn
Bought by
Stump Ronald B and Carol Anne
Purchase Details
Closed on
Dec 29, 1989
Sold by
Katzoff Gerald and Katzoff Lydia
Bought by
Blumenstein Robert and Blumenstein Marilyn
Create a Home Valuation Report for This Property
The Home Valuation Report is an in-depth analysis detailing your home's value as well as a comparison with similar homes in the area
Home Values in the Area
Average Home Value in this Area
Purchase History
| Date | Buyer | Sale Price | Title Company |
|---|---|---|---|
| Ronald B Stump Shore House Irrevocable Reside | -- | None Listed On Document | |
| Stump Ronald B | $475,000 | -- | |
| Stump Ronald B | $475,000 | -- | |
| Blumenstein Robert | $590,000 | -- |
Source: Public Records
Tax History Compared to Growth
Tax History
| Year | Tax Paid | Tax Assessment Tax Assessment Total Assessment is a certain percentage of the fair market value that is determined by local assessors to be the total taxable value of land and additions on the property. | Land | Improvement |
|---|---|---|---|---|
| 2025 | $20,670 | $3,366,500 | $3,325,000 | $41,500 |
| 2024 | $20,670 | $3,366,500 | $3,325,000 | $41,500 |
| 2023 | $20,502 | $3,366,500 | $3,325,000 | $41,500 |
| 2022 | $19,122 | $3,366,500 | $3,325,000 | $41,500 |
| 2021 | $18,415 | $3,366,500 | $3,325,000 | $41,500 |
| 2020 | $17,708 | $3,366,500 | $3,325,000 | $41,500 |
| 2019 | $17,169 | $3,366,500 | $3,325,000 | $41,500 |
| 2018 | $16,429 | $3,366,500 | $3,325,000 | $41,500 |
| 2017 | $17,626 | $3,170,100 | $3,100,000 | $70,100 |
| 2016 | $17,436 | $3,170,100 | $3,100,000 | $70,100 |
| 2015 | $17,150 | $3,170,100 | $3,100,000 | $70,100 |
| 2014 | $16,960 | $3,170,100 | $3,100,000 | $70,100 |
Source: Public Records
Map
Nearby Homes