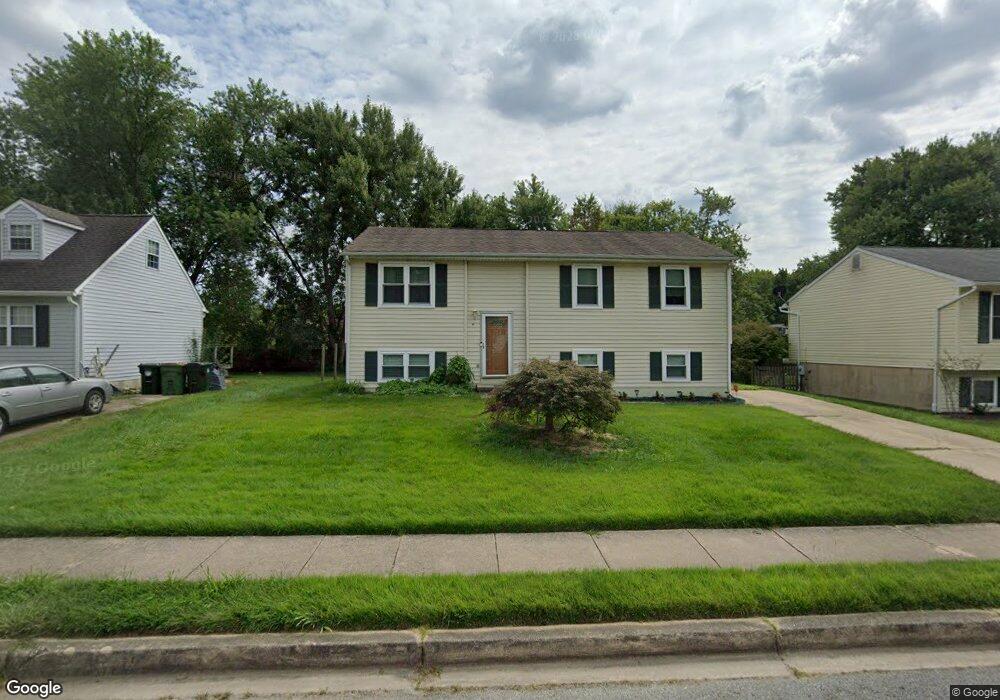
13 Allison Ln Newark, DE 19711
Estimated Value: $328,000 - $392,466
3
Beds
2
Baths
960
Sq Ft
$381/Sq Ft
Est. Value
About This Home
This home is located at 13 Allison Ln, Newark, DE 19711 and is currently estimated at $365,867, approximately $381 per square foot. 13 Allison Ln is a home located in New Castle County with nearby schools including Downes (John R.) Elementary School, Shue-Medill Middle School, and Newark High School.
Ownership History
Date
Name
Owned For
Owner Type
Purchase Details
Closed on
Sep 17, 2024
Sold by
Tata Anthony and Tata Emilia
Bought by
Tata Anthony and Tata Emilia
Current Estimated Value
Purchase Details
Closed on
Nov 16, 2011
Sold by
Tata Anthony and Tata Emilia
Bought by
Tata Anthony and Tata Emilia
Home Financials for this Owner
Home Financials are based on the most recent Mortgage that was taken out on this home.
Original Mortgage
$107,000
Interest Rate
3.92%
Mortgage Type
New Conventional
Purchase Details
Closed on
Apr 27, 2001
Sold by
Schwartz William Meyer and Schwartz Christine Marie
Bought by
Tata Anthony and Tata Emilia
Home Financials for this Owner
Home Financials are based on the most recent Mortgage that was taken out on this home.
Original Mortgage
$118,755
Interest Rate
6.88%
Mortgage Type
FHA
Create a Home Valuation Report for This Property
The Home Valuation Report is an in-depth analysis detailing your home's value as well as a comparison with similar homes in the area
Home Values in the Area
Average Home Value in this Area
Purchase History
| Date | Buyer | Sale Price | Title Company |
|---|---|---|---|
| Tata Anthony | -- | None Listed On Document | |
| Tata Anthony | -- | None Available | |
| Tata Anthony | $126,000 | -- |
Source: Public Records
Mortgage History
| Date | Status | Borrower | Loan Amount |
|---|---|---|---|
| Previous Owner | Tata Anthony | $107,000 | |
| Previous Owner | Tata Anthony | $118,755 | |
| Closed | Tata Anthony | $5,000 |
Source: Public Records
Tax History
| Year | Tax Paid | Tax Assessment Tax Assessment Total Assessment is a certain percentage of the fair market value that is determined by local assessors to be the total taxable value of land and additions on the property. | Land | Improvement |
|---|---|---|---|---|
| 2024 | $691 | $65,500 | $12,300 | $53,200 |
| 2023 | $2,369 | $65,500 | $12,300 | $53,200 |
| 2022 | $2,343 | $65,500 | $12,300 | $53,200 |
| 2021 | $2,283 | $65,500 | $12,300 | $53,200 |
| 2020 | $2,217 | $65,500 | $12,300 | $53,200 |
| 2019 | $1,944 | $65,500 | $12,300 | $53,200 |
| 2018 | $1,899 | $65,500 | $12,300 | $53,200 |
| 2017 | $1,843 | $65,500 | $12,300 | $53,200 |
| 2016 | $1,837 | $65,500 | $12,300 | $53,200 |
| 2015 | $1,647 | $65,500 | $12,300 | $53,200 |
| 2014 | $1,646 | $65,500 | $12,300 | $53,200 |
Source: Public Records
Map
Nearby Homes
Your Personal Tour Guide
Ask me questions while you tour the home.