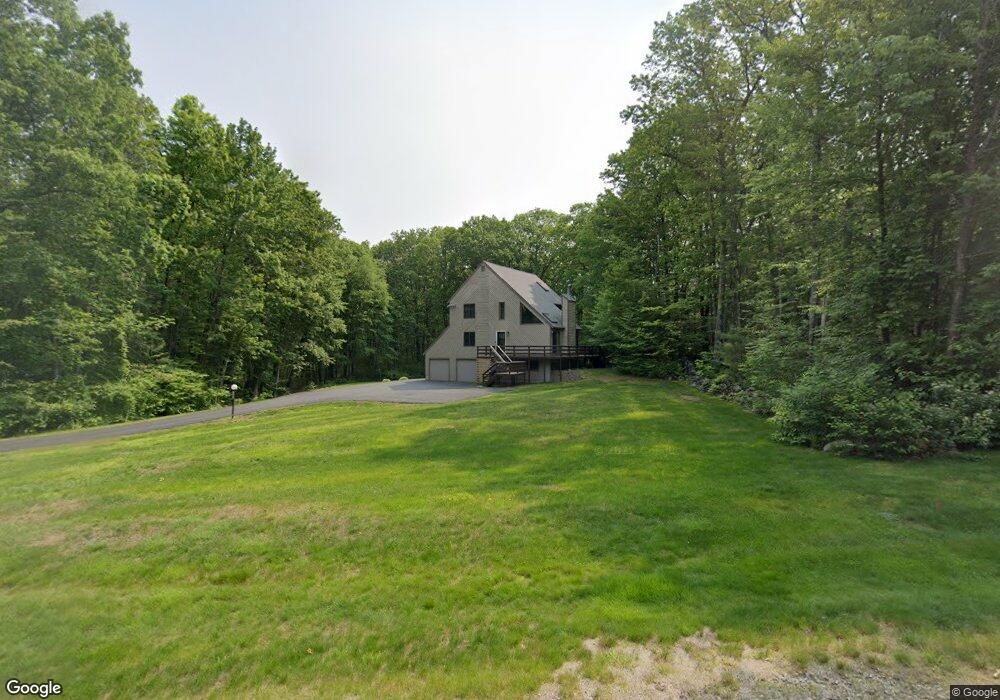
13 Autumn Ln Unit 53 Londonderry, NH 03053
Estimated Value: $674,000 - $701,748
3
Beds
3
Baths
1,948
Sq Ft
$353/Sq Ft
Est. Value
About This Home
This home is located at 13 Autumn Ln Unit 53, Londonderry, NH 03053 and is currently estimated at $688,437, approximately $353 per square foot. 13 Autumn Ln Unit 53 is a home located in Rockingham County with nearby schools including North Londonderry Elementary School, Londonderry Middle School, and Londonderry Senior High School.
Ownership History
Date
Name
Owned For
Owner Type
Purchase Details
Closed on
Jul 28, 2020
Sold by
Bergeron Ft
Bought by
Grennell Lo R
Current Estimated Value
Home Financials for this Owner
Home Financials are based on the most recent Mortgage that was taken out on this home.
Original Mortgage
$374,400
Outstanding Balance
$332,732
Interest Rate
3.1%
Mortgage Type
Purchase Money Mortgage
Estimated Equity
$355,705
Purchase Details
Closed on
Oct 30, 2019
Sold by
Bergeron Richard and Bergeron Barbara A
Bought by
Bergeron Ft
Create a Home Valuation Report for This Property
The Home Valuation Report is an in-depth analysis detailing your home's value as well as a comparison with similar homes in the area
Home Values in the Area
Average Home Value in this Area
Purchase History
| Date | Buyer | Sale Price | Title Company |
|---|---|---|---|
| Grennell Lo R | $416,000 | None Available | |
| Bergeron Ft | -- | -- |
Source: Public Records
Mortgage History
| Date | Status | Borrower | Loan Amount |
|---|---|---|---|
| Open | Grennell Lo R | $374,400 |
Source: Public Records
Tax History Compared to Growth
Tax History
| Year | Tax Paid | Tax Assessment Tax Assessment Total Assessment is a certain percentage of the fair market value that is determined by local assessors to be the total taxable value of land and additions on the property. | Land | Improvement |
|---|---|---|---|---|
| 2024 | $8,494 | $526,300 | $221,500 | $304,800 |
| 2023 | $8,237 | $526,300 | $221,500 | $304,800 |
| 2022 | $8,229 | $445,300 | $166,100 | $279,200 |
| 2021 | $8,185 | $445,300 | $166,100 | $279,200 |
| 2020 | $7,300 | $363,000 | $135,200 | $227,800 |
| 2019 | $7,039 | $363,000 | $135,200 | $227,800 |
| 2018 | $6,908 | $316,900 | $112,100 | $204,800 |
| 2017 | $6,848 | $316,900 | $112,100 | $204,800 |
| 2016 | $6,813 | $316,900 | $112,100 | $204,800 |
| 2015 | $6,747 | $321,000 | $112,100 | $208,900 |
| 2014 | $6,770 | $321,000 | $112,100 | $208,900 |
| 2011 | -- | $330,400 | $112,100 | $218,300 |
Source: Public Records
Map
Nearby Homes
- 75 Rockingham Rd
- 2 B Gale Dr
- 20 Wedgewood Dr
- 29 Beacon St
- 71 N High St Unit 10
- 61 Hardy Rd
- 24 Jefferson St
- 17 1/2 Beacon St
- 57 Hardy Rd
- 99 Rockingham Rd Unit 1
- 38 High St
- 50 Franklin St
- 6 Howard St
- 9 King John Dr
- 103 Rockingham Rd Unit 2
- 103 Rockingham Rd Unit 1
- 3.5 Mt Pleasant St
- 37 Perkins Rd
- 36 Perkins Rd
- 27 Mount Pleasant St Unit R