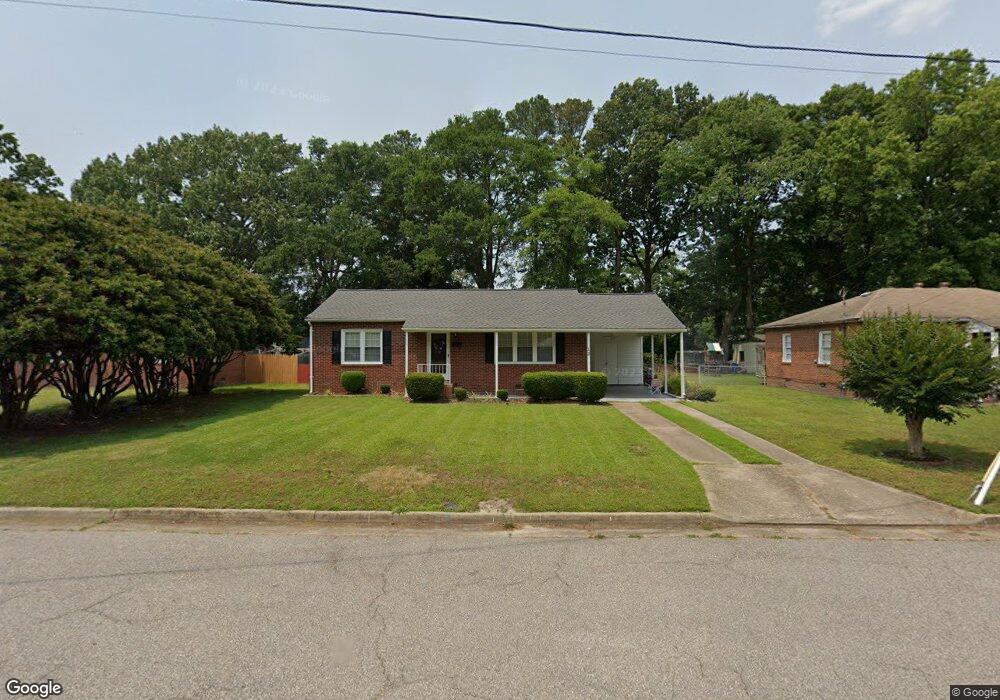
13 Ballard Rd Newport News, VA 23601
Morrison NeighborhoodEstimated Value: $227,117 - $255,000
3
Beds
1
Bath
959
Sq Ft
$249/Sq Ft
Est. Value
About This Home
This home is located at 13 Ballard Rd, Newport News, VA 23601 and is currently estimated at $238,779, approximately $248 per square foot. 13 Ballard Rd is a home located in Newport News City with nearby schools including Riverside Elementary School, Homer L. Hines Middle School, and Warwick High School.
Ownership History
Date
Name
Owned For
Owner Type
Purchase Details
Closed on
Jan 25, 2001
Sold by
Landen Philip D
Bought by
Hancock Timothy E
Current Estimated Value
Home Financials for this Owner
Home Financials are based on the most recent Mortgage that was taken out on this home.
Original Mortgage
$81,257
Outstanding Balance
$30,032
Interest Rate
7.39%
Estimated Equity
$208,747
Purchase Details
Closed on
Feb 23, 1999
Sold by
Rich Jean R
Bought by
Landen Philip D
Home Financials for this Owner
Home Financials are based on the most recent Mortgage that was taken out on this home.
Original Mortgage
$76,469
Interest Rate
6.78%
Create a Home Valuation Report for This Property
The Home Valuation Report is an in-depth analysis detailing your home's value as well as a comparison with similar homes in the area
Home Values in the Area
Average Home Value in this Area
Purchase History
| Date | Buyer | Sale Price | Title Company |
|---|---|---|---|
| Hancock Timothy E | $81,900 | -- | |
| Landen Philip D | $77,100 | -- |
Source: Public Records
Mortgage History
| Date | Status | Borrower | Loan Amount |
|---|---|---|---|
| Open | Hancock Timothy E | $81,257 | |
| Previous Owner | Landen Philip D | $76,469 |
Source: Public Records
Tax History Compared to Growth
Tax History
| Year | Tax Paid | Tax Assessment Tax Assessment Total Assessment is a certain percentage of the fair market value that is determined by local assessors to be the total taxable value of land and additions on the property. | Land | Improvement |
|---|---|---|---|---|
| 2024 | $2,583 | $218,900 | $60,500 | $158,400 |
| 2023 | $2,642 | $211,400 | $60,500 | $150,900 |
| 2022 | $2,481 | $194,500 | $60,500 | $134,000 |
| 2021 | $1,998 | $163,800 | $55,000 | $108,800 |
| 2020 | $2,023 | $153,800 | $55,000 | $98,800 |
| 2019 | $1,939 | $147,300 | $55,000 | $92,300 |
| 2018 | $1,807 | $136,700 | $55,000 | $81,700 |
| 2017 | $1,757 | $134,300 | $55,000 | $79,300 |
| 2016 | $1,753 | $134,300 | $55,000 | $79,300 |
| 2015 | $1,767 | $134,300 | $55,000 | $79,300 |
| 2014 | $1,586 | $139,400 | $55,000 | $84,400 |
Source: Public Records
Map
Nearby Homes