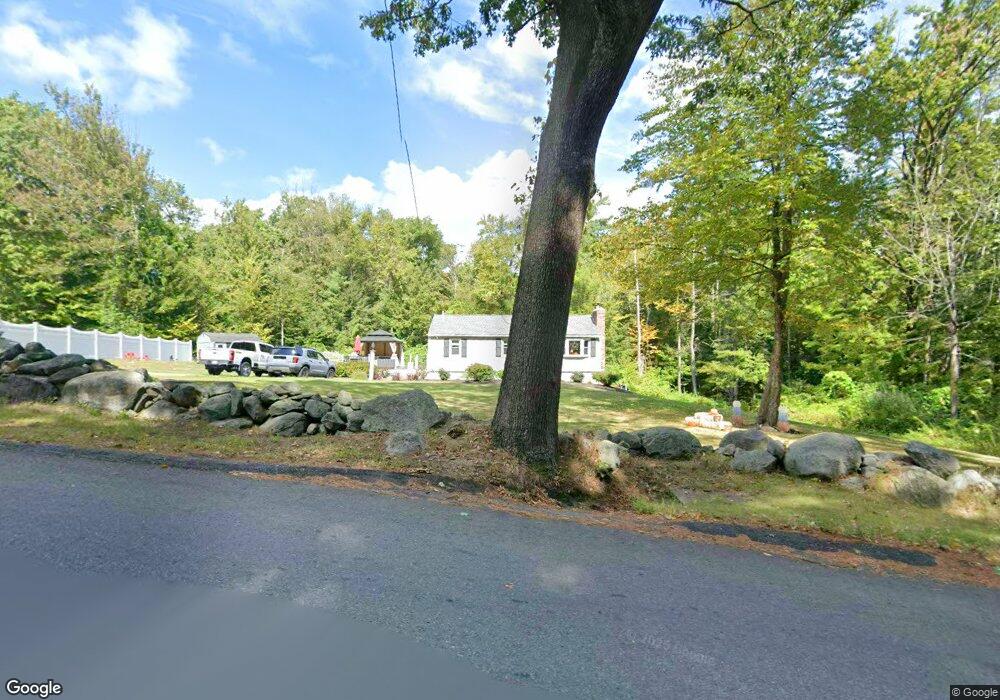
13 Bayberry Hill Rd Townsend, MA 01469
Estimated Value: $467,000 - $495,000
3
Beds
1
Bath
1,440
Sq Ft
$332/Sq Ft
Est. Value
About This Home
This home is located at 13 Bayberry Hill Rd, Townsend, MA 01469 and is currently estimated at $477,514, approximately $331 per square foot. 13 Bayberry Hill Rd is a home located in Middlesex County with nearby schools including North Middlesex Regional High School.
Ownership History
Date
Name
Owned For
Owner Type
Purchase Details
Closed on
Jun 12, 2007
Sold by
Bates Ft and Bates
Bought by
Perry Frank
Current Estimated Value
Home Financials for this Owner
Home Financials are based on the most recent Mortgage that was taken out on this home.
Original Mortgage
$191,250
Outstanding Balance
$116,898
Interest Rate
6.17%
Mortgage Type
Purchase Money Mortgage
Estimated Equity
$360,616
Purchase Details
Closed on
Dec 28, 2006
Sold by
Bates Brenda
Bought by
Bates Ft and Bates
Home Financials for this Owner
Home Financials are based on the most recent Mortgage that was taken out on this home.
Original Mortgage
$130,000
Interest Rate
6.36%
Mortgage Type
Purchase Money Mortgage
Purchase Details
Closed on
Nov 30, 2006
Sold by
Perrault Amy N and Perrault James E
Bought by
Bates Brenda
Home Financials for this Owner
Home Financials are based on the most recent Mortgage that was taken out on this home.
Original Mortgage
$130,000
Interest Rate
6.36%
Mortgage Type
Purchase Money Mortgage
Purchase Details
Closed on
May 16, 1997
Sold by
Pappas Michael T and Pappas Donna M
Bought by
Smith Dean F and Smith Connie L
Home Financials for this Owner
Home Financials are based on the most recent Mortgage that was taken out on this home.
Original Mortgage
$102,100
Interest Rate
8.12%
Mortgage Type
Purchase Money Mortgage
Create a Home Valuation Report for This Property
The Home Valuation Report is an in-depth analysis detailing your home's value as well as a comparison with similar homes in the area
Home Values in the Area
Average Home Value in this Area
Purchase History
| Date | Buyer | Sale Price | Title Company |
|---|---|---|---|
| Perry Frank | $255,000 | -- | |
| Bates Ft | -- | -- | |
| Bates Brenda | $255,000 | -- | |
| Smith Dean F | $107,500 | -- |
Source: Public Records
Mortgage History
| Date | Status | Borrower | Loan Amount |
|---|---|---|---|
| Open | Perry Frank | $191,250 | |
| Previous Owner | Bates Brenda | $130,000 | |
| Previous Owner | Smith Dean F | $20,000 | |
| Previous Owner | Smith Dean F | $107,000 | |
| Previous Owner | Smith Dean F | $102,100 |
Source: Public Records
Tax History Compared to Growth
Tax History
| Year | Tax Paid | Tax Assessment Tax Assessment Total Assessment is a certain percentage of the fair market value that is determined by local assessors to be the total taxable value of land and additions on the property. | Land | Improvement |
|---|---|---|---|---|
| 2025 | $5,396 | $371,600 | $95,600 | $276,000 |
| 2024 | $5,291 | $367,200 | $95,600 | $271,600 |
| 2023 | $4,773 | $312,800 | $82,600 | $230,200 |
| 2022 | $4,924 | $279,600 | $75,600 | $204,000 |
| 2021 | $5,066 | $276,400 | $74,800 | $201,600 |
| 2020 | $4,868 | $249,400 | $67,800 | $181,600 |
| 2019 | $4,792 | $247,900 | $67,800 | $180,100 |
| 2018 | $4,457 | $220,000 | $60,900 | $159,100 |
| 2017 | $4,203 | $213,700 | $63,900 | $149,800 |
| 2016 | $3,875 | $195,700 | $63,900 | $131,800 |
| 2015 | $3,933 | $205,800 | $70,900 | $134,900 |
| 2014 | $3,646 | $186,300 | $66,500 | $119,800 |
Source: Public Records
Map
Nearby Homes
- 20 Bayberry Hill Rd
- 1 Depot Street Extension Unit 2
- 1 Depot Street Extension Unit 5
- 1 Depot Street Extension Unit 3
- 1 Depot Street Extension Unit 4
- 2 Tamarack Ln
- 30 Bailey Rd
- 10 Stearns Ave
- 86 W Elm Lunenburg Rd Blood Rd
- 0 Tyler Rd Unit 72560808
- 144 Main St
- 75 Highland St
- 91 Lunenburg Rd
- 00 Tyler Rd
- 91 Highland St
- 11 Fox Run
- 5 Chestnut Dr
- 64 Meadow Rd
- 31 South St
- 18 Beech St
- 17 Bayberry Hill Rd
- 17 Bayberry Hill Rd
- 11 Bayberry Hill Rd
- 14 Bayberry Hill Rd
- 10 Bayberry Hill Rd
- 9 Bayberry Hill Rd
- 19 Bayberry Hill Rd
- 15 Bayberry Hill Rd
- 21 Bayberry Hill Rd
- 18 Bayberry Hill Rd
- 4 Bayberry Hill Rd
- 5 Bayberry Hill Rd
- 4 Bayberry Hill Rd
- 79 Fitchburg Rd
- 1 Bayberry Hill Rd
- 1 Bayberry Hill Rd
- 99 Clement Rd
- 65 Fitchburg Rd
- 69 Fitchburg Rd
- 22 Bayberry Hill Rd