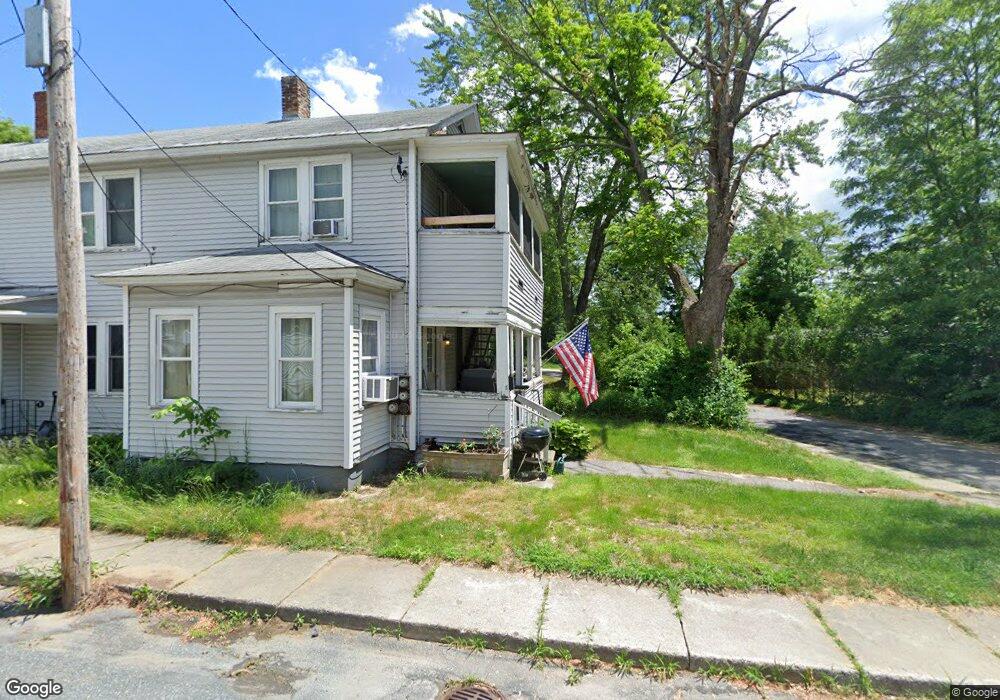
13 Belding St Claremont, NH 03743
North End NeighborhoodEstimated Value: $247,615 - $334,000
6
Beds
2
Baths
2,070
Sq Ft
$132/Sq Ft
Est. Value
About This Home
This home is located at 13 Belding St, Claremont, NH 03743 and is currently estimated at $273,404, approximately $132 per square foot. 13 Belding St is a home located in Sullivan County with nearby schools including Disnard Elementary School, Claremont Middle School, and Stevens High School.
Ownership History
Date
Name
Owned For
Owner Type
Purchase Details
Closed on
Aug 26, 2019
Sold by
Cochran Timothy P
Bought by
Cochran Timothy P and Jenkins James J
Current Estimated Value
Home Financials for this Owner
Home Financials are based on the most recent Mortgage that was taken out on this home.
Original Mortgage
$132,000
Outstanding Balance
$110,426
Interest Rate
3.7%
Mortgage Type
VA
Estimated Equity
$162,978
Purchase Details
Closed on
May 3, 2016
Sold by
Reuthe James T
Bought by
Cochran Timothy P
Purchase Details
Closed on
Nov 29, 2010
Sold by
Us Bank Na Tr
Bought by
Reuthe James T
Purchase Details
Closed on
Aug 6, 2010
Sold by
Skrocki Tracy A
Bought by
Rasc T
Create a Home Valuation Report for This Property
The Home Valuation Report is an in-depth analysis detailing your home's value as well as a comparison with similar homes in the area
Home Values in the Area
Average Home Value in this Area
Purchase History
| Date | Buyer | Sale Price | Title Company |
|---|---|---|---|
| Cochran Timothy P | -- | -- | |
| Cochran Timothy P | $132,333 | -- | |
| Reuthe James T | $62,900 | -- | |
| Rasc T | $58,200 | -- |
Source: Public Records
Mortgage History
| Date | Status | Borrower | Loan Amount |
|---|---|---|---|
| Open | Cochran Timothy P | $132,000 |
Source: Public Records
Tax History Compared to Growth
Tax History
| Year | Tax Paid | Tax Assessment Tax Assessment Total Assessment is a certain percentage of the fair market value that is determined by local assessors to be the total taxable value of land and additions on the property. | Land | Improvement |
|---|---|---|---|---|
| 2024 | $5,957 | $203,600 | $39,400 | $164,200 |
| 2023 | $5,660 | $203,600 | $39,400 | $164,200 |
| 2022 | $4,727 | $113,400 | $18,500 | $94,900 |
| 2021 | $4,647 | $113,400 | $18,500 | $94,900 |
| 2020 | $4,618 | $113,400 | $18,500 | $94,900 |
| 2019 | $4,602 | $114,300 | $18,500 | $95,800 |
| 2018 | $5,188 | $123,300 | $18,500 | $104,800 |
| 2017 | $5,260 | $123,300 | $18,500 | $104,800 |
| 2016 | $6,022 | $141,300 | $18,500 | $122,800 |
| 2015 | $5,860 | $141,300 | $18,500 | $122,800 |
| 2014 | $5,840 | $141,300 | $18,500 | $122,800 |
| 2013 | $5,177 | $142,800 | $20,700 | $122,100 |
Source: Public Records
Map
Nearby Homes