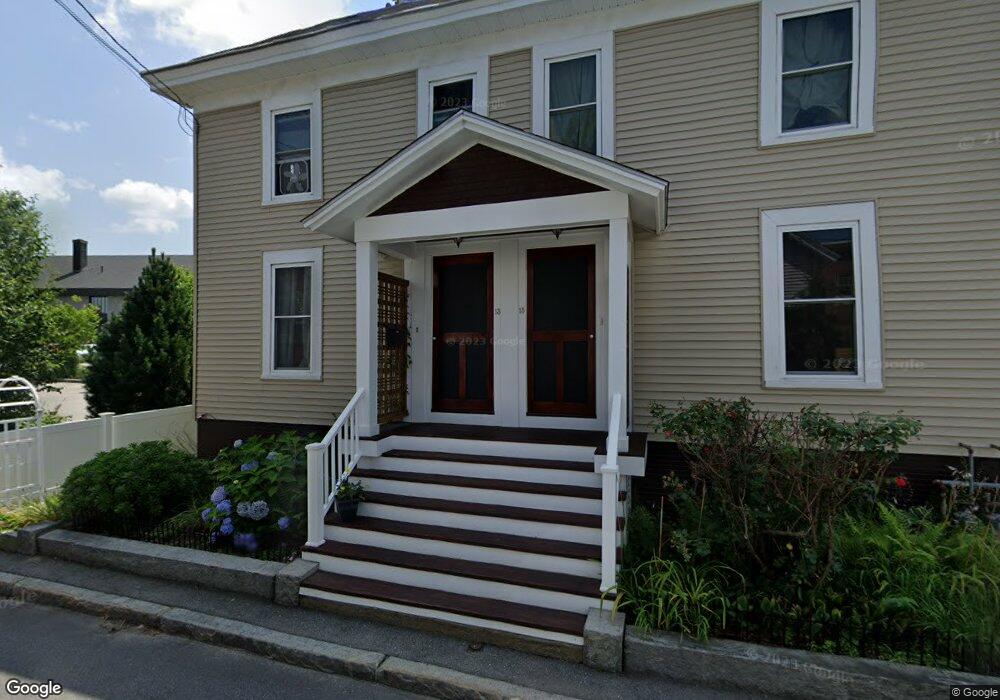
13 Blake St Unit 15 Concord, NH 03301
North End NeighborhoodEstimated Value: $548,000 - $713,000
6
Beds
3
Baths
3,256
Sq Ft
$193/Sq Ft
Est. Value
About This Home
This home is located at 13 Blake St Unit 15, Concord, NH 03301 and is currently estimated at $628,253, approximately $192 per square foot. 13 Blake St Unit 15 is a home located in Merrimack County with nearby schools including Christa McAuliffe School, Rundlett Middle School, and Concord High School.
Ownership History
Date
Name
Owned For
Owner Type
Purchase Details
Closed on
Jun 27, 2003
Sold by
Vocca Peter and Vocca Ursula
Bought by
Maynard Jeffrey R and Maynard Caren M
Current Estimated Value
Home Financials for this Owner
Home Financials are based on the most recent Mortgage that was taken out on this home.
Original Mortgage
$194,750
Interest Rate
5.53%
Mortgage Type
Purchase Money Mortgage
Create a Home Valuation Report for This Property
The Home Valuation Report is an in-depth analysis detailing your home's value as well as a comparison with similar homes in the area
Home Values in the Area
Average Home Value in this Area
Purchase History
| Date | Buyer | Sale Price | Title Company |
|---|---|---|---|
| Maynard Jeffrey R | $205,000 | -- | |
| Maynard Jeffrey R | $205,000 | -- |
Source: Public Records
Mortgage History
| Date | Status | Borrower | Loan Amount |
|---|---|---|---|
| Open | Maynard Jeffrey R | $156,000 | |
| Closed | Maynard Jeffrey R | $194,750 |
Source: Public Records
Tax History Compared to Growth
Tax History
| Year | Tax Paid | Tax Assessment Tax Assessment Total Assessment is a certain percentage of the fair market value that is determined by local assessors to be the total taxable value of land and additions on the property. | Land | Improvement |
|---|---|---|---|---|
| 2024 | $12,945 | $467,500 | $99,700 | $367,800 |
| 2023 | $12,557 | $467,500 | $99,700 | $367,800 |
| 2022 | $12,104 | $467,500 | $99,700 | $367,800 |
| 2021 | $11,580 | $461,000 | $99,700 | $361,300 |
| 2020 | $7,228 | $270,100 | $79,700 | $190,400 |
| 2019 | $7,120 | $256,300 | $75,500 | $180,800 |
| 2018 | $7,141 | $253,300 | $71,000 | $182,300 |
| 2017 | $6,947 | $246,000 | $68,800 | $177,200 |
| 2016 | $6,098 | $220,400 | $63,100 | $157,300 |
| 2015 | $5,550 | $203,000 | $58,500 | $144,500 |
| 2014 | $5,442 | $203,000 | $58,500 | $144,500 |
| 2013 | -- | $191,000 | $58,500 | $132,500 |
| 2012 | $5,157 | $211,600 | $58,500 | $153,100 |
Source: Public Records
Map
Nearby Homes
- 10 N State St
- 54 Pleasant St Unit 8
- 25 Fayette St
- 17 Essex St
- 37 Thorndike St
- 87 S Main St Unit 2
- 75 S State St
- 14-16 Perley St
- 10 Perley St
- 14 Downing St
- 11 Washington St
- 30 Jackson St
- 8 Tremont St
- 2 Herbert St
- 0 Spruce St Unit 88
- 6 Herbert St
- 119 Rumford St
- 33 Spruce St
- 24 Badger St
- 157 Rumford St