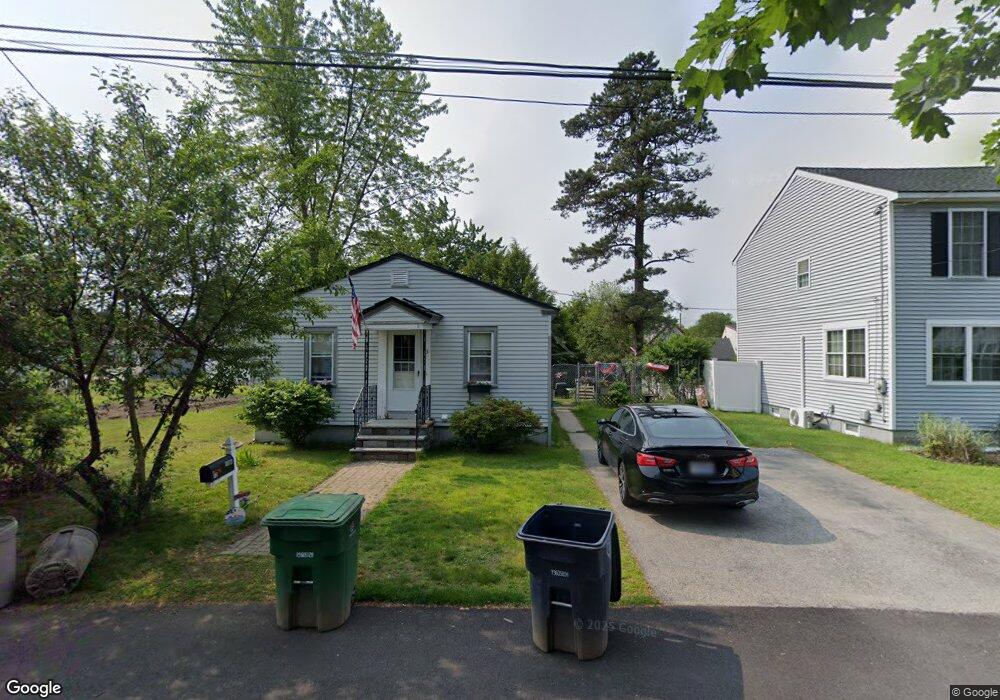
13 Booth St Nashua, NH 03060
South End Nashua NeighborhoodEstimated Value: $342,789 - $360,000
2
Beds
1
Bath
675
Sq Ft
$522/Sq Ft
Est. Value
About This Home
This home is located at 13 Booth St, Nashua, NH 03060 and is currently estimated at $352,447, approximately $522 per square foot. 13 Booth St is a home located in Hillsborough County with nearby schools including Fairgrounds Elementary School, Fairgrounds Middle School, and Nashua High School South.
Ownership History
Date
Name
Owned For
Owner Type
Purchase Details
Closed on
May 29, 2008
Sold by
Decourcy Andrew Paul
Bought by
Bouley Kimberly L
Current Estimated Value
Home Financials for this Owner
Home Financials are based on the most recent Mortgage that was taken out on this home.
Original Mortgage
$72,400
Outstanding Balance
$45,922
Interest Rate
5.91%
Mortgage Type
Purchase Money Mortgage
Estimated Equity
$306,525
Create a Home Valuation Report for This Property
The Home Valuation Report is an in-depth analysis detailing your home's value as well as a comparison with similar homes in the area
Home Values in the Area
Average Home Value in this Area
Purchase History
| Date | Buyer | Sale Price | Title Company |
|---|---|---|---|
| Bouley Kimberly L | $167,400 | -- |
Source: Public Records
Mortgage History
| Date | Status | Borrower | Loan Amount |
|---|---|---|---|
| Open | Bouley Kimberly L | $72,400 | |
| Previous Owner | Bouley Kimberly L | $15,000 | |
| Previous Owner | Bouley Kimberly L | $115,000 |
Source: Public Records
Tax History Compared to Growth
Tax History
| Year | Tax Paid | Tax Assessment Tax Assessment Total Assessment is a certain percentage of the fair market value that is determined by local assessors to be the total taxable value of land and additions on the property. | Land | Improvement |
|---|---|---|---|---|
| 2024 | $4,282 | $269,300 | $126,900 | $142,400 |
| 2023 | $4,080 | $223,800 | $101,500 | $122,300 |
| 2022 | $4,044 | $223,800 | $101,500 | $122,300 |
| 2021 | $3,560 | $153,300 | $67,700 | $85,600 |
| 2020 | $3,437 | $152,000 | $67,700 | $84,300 |
| 2019 | $3,308 | $152,000 | $67,700 | $84,300 |
| 2018 | $3,224 | $152,000 | $67,700 | $84,300 |
| 2017 | $3,175 | $123,100 | $63,900 | $59,200 |
| 2016 | $3,086 | $123,100 | $63,900 | $59,200 |
| 2015 | $3,020 | $123,100 | $63,900 | $59,200 |
| 2014 | $2,961 | $123,100 | $63,900 | $59,200 |
Source: Public Records
Map
Nearby Homes
- 22 Kern Dr
- 22 New Dunstable Rd Unit 132133
- 11 Bordeaux St
- 97 Linwood St
- 41 New Dunstable Rd Unit 371
- 169A W Hollis St Unit 193
- 63 Dexter St
- 4 Badger St
- 121 Palm St
- 22 Wilder St
- 15 Lovell St Unit 20
- 15 Lovell St Unit 3
- 15 Lovell St Unit 7
- 15 Lovell St Unit 10
- 30 Ledge St
- 8 Buck St Unit 10
- 247 Main Dunstable Rd
- 38 Central St
- 29 Greenwood Dr
- 4 Henry David Dr Unit 203
- 11 Booth St
- 14 Blanchard St
- L Caldwell Rd
- 9 Booth St
- 5 Caldwell Rd Unit 45
- 10 Blanchard St Unit 58
- 7 Caldwell Rd Unit 61
- 8 Booth St Unit 33
- 14 Booth St Unit 35
- 6 Booth St
- 5 Booth St Unit 50
- 21 Booth St Unit 43
- 8 Caldwell Rd
- 8 Blanchard St Unit 55
- 20 Booth St Unit 37
- 15 Blanchard St
- 268 Lake St Unit 7
- 11 Blanchard St
- 262 Lake St
- 6 Blanchard St Unit 131