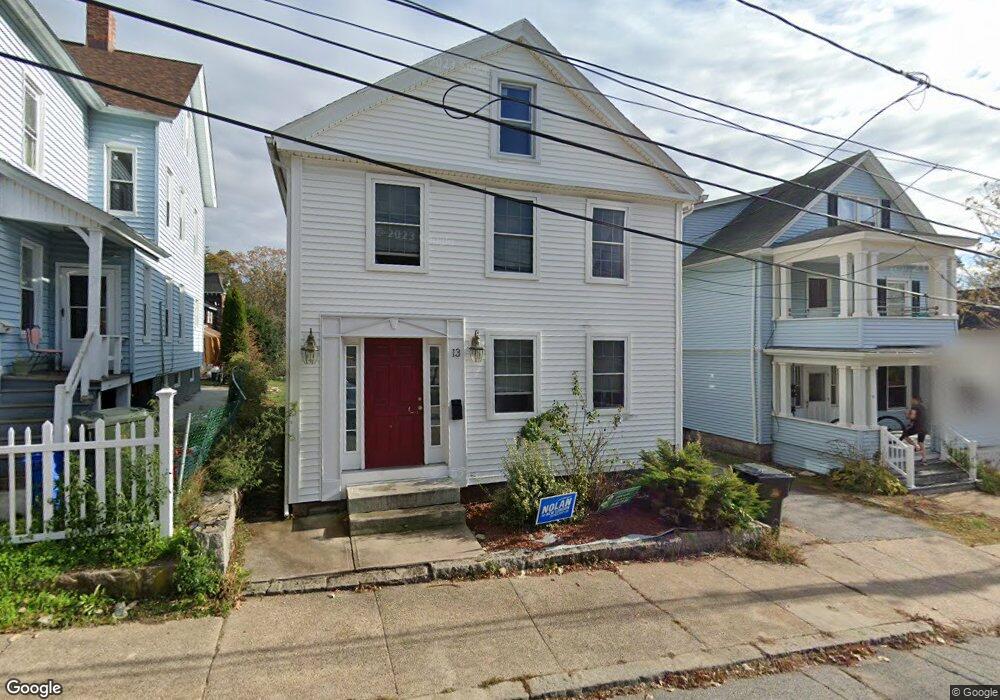
13 Brainard St New London, CT 06320
Williams NeighborhoodEstimated Value: $270,000 - $422,000
5
Beds
2
Baths
1,920
Sq Ft
$171/Sq Ft
Est. Value
About This Home
This home is located at 13 Brainard St, New London, CT 06320 and is currently estimated at $328,442, approximately $171 per square foot. 13 Brainard St is a home located in New London County with nearby schools including Harbor Elementary School, Bennie Dover Jackson Middle School, and New London High School.
Ownership History
Date
Name
Owned For
Owner Type
Purchase Details
Closed on
Mar 29, 2012
Sold by
Habitat For Humanity
Bought by
Oneil Jennifer P
Current Estimated Value
Home Financials for this Owner
Home Financials are based on the most recent Mortgage that was taken out on this home.
Original Mortgage
$25,000
Outstanding Balance
$3,375
Interest Rate
3.88%
Estimated Equity
$325,067
Purchase Details
Closed on
Apr 23, 2010
Sold by
Bank Of America Na
Bought by
Habitat Humanity South
Purchase Details
Closed on
Dec 22, 2009
Sold by
Ventura Miguel
Bought by
Lasalle Bk
Purchase Details
Closed on
Dec 6, 2005
Sold by
Deleon Alin H
Bought by
Ventura Miguel
Purchase Details
Closed on
Mar 8, 2004
Sold by
Lavalle Scott
Bought by
Marte Franklin and Deleon Alin
Purchase Details
Closed on
Mar 1, 2002
Sold by
Lloyd Engram A
Bought by
Lavallee Scott M
Purchase Details
Closed on
Jul 10, 1997
Sold by
Rodriguez Jose L and Rodriquez Maria M
Bought by
Aquino Justo and Aquino Marta
Create a Home Valuation Report for This Property
The Home Valuation Report is an in-depth analysis detailing your home's value as well as a comparison with similar homes in the area
Home Values in the Area
Average Home Value in this Area
Purchase History
| Date | Buyer | Sale Price | Title Company |
|---|---|---|---|
| Oneil Jennifer P | $190,000 | -- | |
| Oneil Jennifer P | $190,000 | -- | |
| Habitat Humanity South | $75,000 | -- | |
| Habitat Humanity South | $75,000 | -- | |
| Lasalle Bk | -- | -- | |
| Lasalle Bk | -- | -- | |
| Ventura Miguel | $220,000 | -- | |
| Ventura Miguel | $220,000 | -- | |
| Marte Franklin | $138,000 | -- | |
| Marte Franklin | $138,000 | -- | |
| Lavallee Scott M | $90,000 | -- | |
| Aquino Justo | $76,000 | -- | |
| Aquino Justo | $76,000 | -- |
Source: Public Records
Mortgage History
| Date | Status | Borrower | Loan Amount |
|---|---|---|---|
| Open | Aquino Justo | $25,000 |
Source: Public Records
Tax History Compared to Growth
Tax History
| Year | Tax Paid | Tax Assessment Tax Assessment Total Assessment is a certain percentage of the fair market value that is determined by local assessors to be the total taxable value of land and additions on the property. | Land | Improvement |
|---|---|---|---|---|
| 2025 | $5,307 | $195,100 | $33,300 | $161,800 |
| 2024 | $5,365 | $195,100 | $33,300 | $161,800 |
| 2023 | $3,928 | $105,490 | $13,930 | $91,560 |
| 2022 | $3,936 | $105,490 | $13,930 | $91,560 |
| 2021 | $4,003 | $105,490 | $13,930 | $91,560 |
| 2020 | $4,029 | $105,490 | $13,930 | $91,560 |
| 2019 | $4,209 | $105,490 | $13,930 | $91,560 |
| 2018 | $4,663 | $106,610 | $17,710 | $88,900 |
| 2017 | $4,719 | $106,610 | $17,710 | $88,900 |
| 2016 | $4,313 | $106,610 | $17,710 | $88,900 |
| 2015 | $4,210 | $106,610 | $17,710 | $88,900 |
| 2014 | $3,654 | $106,610 | $17,710 | $88,900 |
Source: Public Records
Map
Nearby Homes
- 38 Mountain Ave
- 59 Connecticut Ave
- 55 Connecticut Ave
- 40 Pearl St
- 2 Coit St Unit 1
- 9 Brewer St Unit 3
- 9 Brewer St Unit 1
- 9 Brewer St Unit 2
- 9 Brewer St
- 49 Belden St
- 139 Vauxhall St
- 400 Bank St Unit 105
- 18 W Pleasant St
- 26 Jefferson Ave
- 835 Bank St
- 77 Colman St
- 385 Broad St
- 23 Whittlesey St
- 32 Moore Ave
- 68 Raymond St
- 15 Brainard St
- 17 Brainard St
- 11 Brainard St Unit 3rd fl
- 11 Brainard St
- 11 Brainard St Unit 3
- 11 Brainard St Unit 2
- 11 Brainard St Unit 2nd Fl
- 21 Brainard St
- 7 Brainard St
- 23 Brainard St
- 140 Hempstead St
- 11 Mercer St
- 1 Brainard St
- 144 Hempstead St
- 25 Brainard St
- 150 Hempstead St
- 29 Brainard St
- 126 Hempstead St
- 154 Hempstead St
- 33 Brainard St