13 Brian Ct Unit 2 Algonquin, IL 60102
Estimated Value: $275,000 - $294,317
About This Home
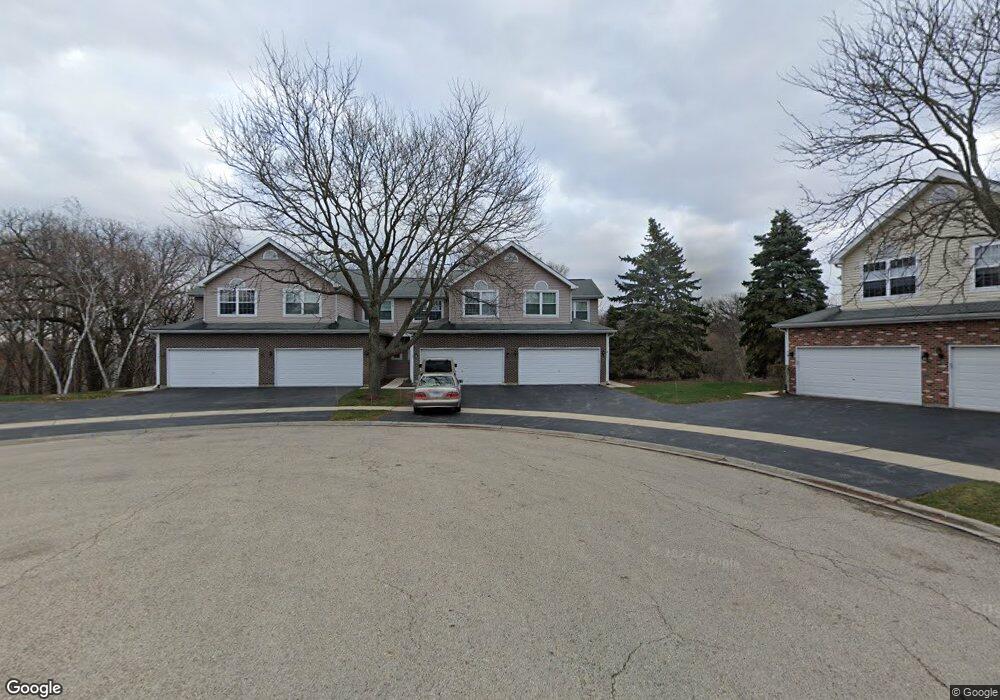
This home is located at 13 Brian Ct Unit 2, Algonquin, IL 60102 and is currently estimated at $285,579, approximately $204 per square foot. 13 Brian Ct Unit 2 is a home located in McHenry County with nearby schools including Westfield Community School, Kenneth E Neubert Elementary School, and Harry D Jacobs High School.
Ownership History
We collect this data history from publicly available records. To have your information removed, we recommend requesting removal directly through your county’s website.
Purchase Details
Home Financials for this Owner
Home Financials are based on the most recent Mortgage that was taken out on this home.Purchase Details
Home Financials for this Owner
Home Financials are based on the most recent Mortgage that was taken out on this home.Purchase Details
Purchase Details
Home Financials for this Owner
Home Financials are based on the most recent Mortgage that was taken out on this home.Purchase Details
Home Financials for this Owner
Home Financials are based on the most recent Mortgage that was taken out on this home.Purchase History
We collect this data history from publicly available records. To have your information removed, we recommend requesting removal directly through your county’s website.
| Date | Buyer | Sale Price | Title Company |
|---|---|---|---|
| $280,000 | None Listed On Document | ||
| -- | None Available | ||
| $71,000 | None Available | ||
| $170,000 | -- | ||
| $127,000 | -- |
Mortgage History
We collect this data history from publicly available records. To have your information removed, we recommend requesting removal directly through your county’s website.
| Date | Status | Borrower | Loan Amount |
|---|---|---|---|
| Open | $200,004 | ||
| Previous Owner | $513,315,800 | ||
| Previous Owner | $138,040 | ||
| Previous Owner | $95,000 |
Tax History
We collect this data history from publicly available records. To have your information removed, we recommend requesting removal directly through your county’s website.
| Year | Tax Paid | Tax Assessment Tax Assessment Total Assessment is a certain percentage of the fair market value that is determined by local assessors to be the total taxable value of land and additions on the property. | Land | Improvement |
|---|---|---|---|---|
| 2024 | $6,235 | $79,705 | $13,825 | $65,880 |
| 2023 | $5,967 | $71,286 | $12,365 | $58,921 |
| 2022 | $5,179 | $60,386 | $11,160 | $49,226 |
| 2021 | $4,992 | $56,257 | $10,397 | $45,860 |
| 2020 | $4,873 | $54,266 | $10,029 | $44,237 |
| 2019 | $4,769 | $51,939 | $9,599 | $42,340 |
| 2018 | $4,488 | $47,083 | $8,867 | $38,216 |
| 2017 | $4,417 | $44,355 | $8,353 | $36,002 |
| 2016 | $4,375 | $41,601 | $7,834 | $33,767 |
| 2013 | -- | $50,297 | $7,308 | $42,989 |
Map
- 310 Crestwood Ct
- 1 Grandview Ct
- 1431 Essex St
- 342 Country Ln
- 275 Farmhill Dr
- LOT 3 Blackhawk Dr
- 1600 Huntington Dr N
- 425 Somerset Ct
- 355 Hiawatha Dr
- 986 Viewpoint Dr
- 461 Candlewood Ct
- 368 Hiawatha Dr
- 640 Clearview Ct
- 973 Mesa Dr
- 490 Flora Dr
- 650 Butterfield Dr
- 1039 Viewpoint Dr
- 190 Lake Dr S
- 416 Grace Dr
- 525 Skyline Dr
Ask me questions while you tour the home.