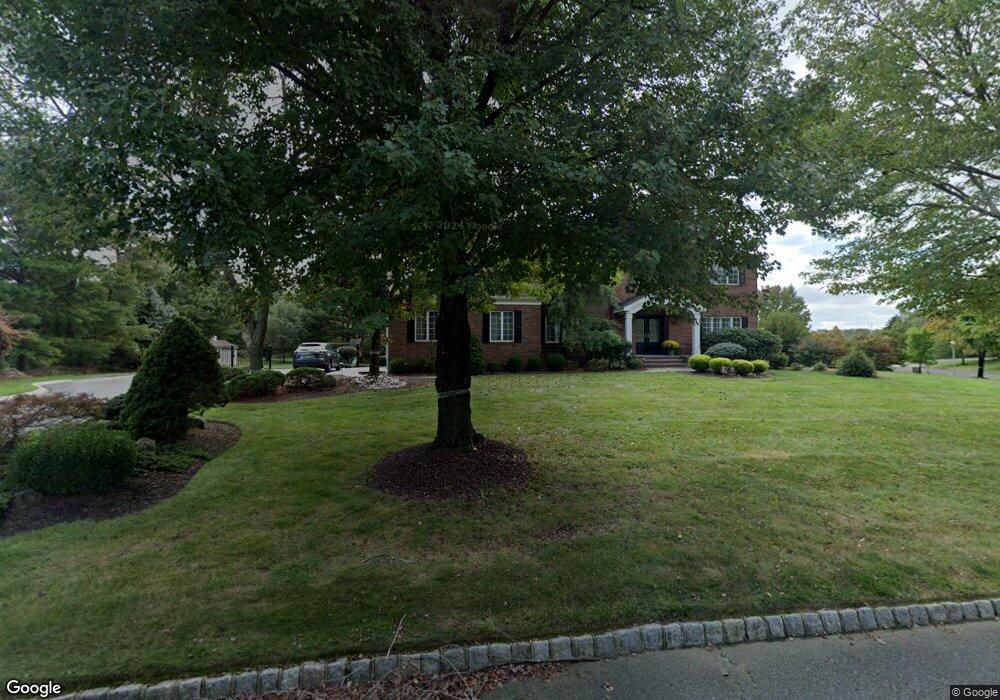
13 Bryce Rd Holmdel, NJ 07733
Estimated Value: $1,355,000 - $1,592,000
4
Beds
2
Baths
2,870
Sq Ft
$509/Sq Ft
Est. Value
About This Home
This home is located at 13 Bryce Rd, Holmdel, NJ 07733 and is currently estimated at $1,462,028, approximately $509 per square foot. 13 Bryce Rd is a home located in Monmouth County with nearby schools including Village School, Indian Hill Elementary School, and William Satz Intermediate School.
Ownership History
Date
Name
Owned For
Owner Type
Purchase Details
Closed on
Nov 27, 2020
Sold by
Saporito Joseph and Saporito Nicole
Bought by
Thain Mark R and Cascella Christine
Current Estimated Value
Home Financials for this Owner
Home Financials are based on the most recent Mortgage that was taken out on this home.
Original Mortgage
$765,000
Outstanding Balance
$682,293
Interest Rate
2.8%
Mortgage Type
New Conventional
Estimated Equity
$779,735
Purchase Details
Closed on
Jul 11, 2014
Sold by
Chuang Justin and Chuang Prudence
Bought by
Saporito Joseph and Saporito Nicole
Purchase Details
Closed on
Apr 24, 1996
Sold by
Large Ronald
Bought by
Chuang Justin and Chuang Prudence
Home Financials for this Owner
Home Financials are based on the most recent Mortgage that was taken out on this home.
Original Mortgage
$300,000
Interest Rate
7.67%
Create a Home Valuation Report for This Property
The Home Valuation Report is an in-depth analysis detailing your home's value as well as a comparison with similar homes in the area
Home Values in the Area
Average Home Value in this Area
Purchase History
| Date | Buyer | Sale Price | Title Company |
|---|---|---|---|
| Thain Mark R | $999,999 | Two Rivers Title Co Llc | |
| Saporito Joseph | $785,000 | None Available | |
| Chuang Justin | $410,000 | -- |
Source: Public Records
Mortgage History
| Date | Status | Borrower | Loan Amount |
|---|---|---|---|
| Open | Thain Mark R | $765,000 | |
| Previous Owner | Chuang Justin | $300,000 |
Source: Public Records
Tax History
| Year | Tax Paid | Tax Assessment Tax Assessment Total Assessment is a certain percentage of the fair market value that is determined by local assessors to be the total taxable value of land and additions on the property. | Land | Improvement |
|---|---|---|---|---|
| 2025 | $19,777 | $1,395,900 | $614,400 | $781,500 |
| 2024 | $19,290 | $1,254,900 | $582,800 | $672,100 |
Source: Public Records
Map
Nearby Homes
- 7 Mccampbell Rd
- 660 County Route 520
- 86 Stillwell Rd
- 246 Sunnyside Rd
- 97 Lawley Dr
- 56 Eckert Dr Unit 4204
- 158 Willow Grove Dr
- 45 Turnberry Dr
- 10 Hop Brook Ln
- 31 Langton Dr
- 185 Ballantine Rd
- 17 Spalding Dr
- 129 Four Winds Dr
- 911 Middletown Lincroft Rd
- 23 Stratford Ln Unit 483
- 3 Deridder Ct
- 7 Cormorant Dr
- 41 Polly Way
- 1 E Point Rd
- 7 Boxwood Terrace Unit 250
Your Personal Tour Guide
Ask me questions while you tour the home.