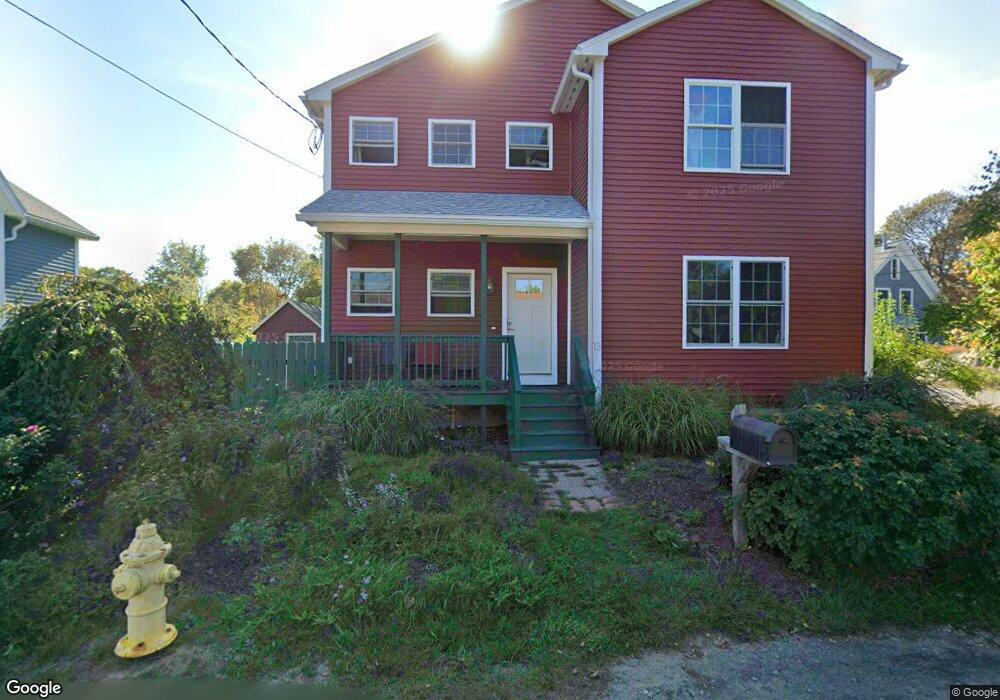
13 Calder St Gloucester, MA 01930
East Gloucester NeighborhoodEstimated Value: $830,000 - $1,229,000
3
Beds
3
Baths
2,112
Sq Ft
$461/Sq Ft
Est. Value
About This Home
This home is located at 13 Calder St, Gloucester, MA 01930 and is currently estimated at $973,968, approximately $461 per square foot. 13 Calder St is a home located in Essex County with nearby schools including East Gloucester Elementary School, Ralph B O'maley Middle School, and Gloucester High School.
Ownership History
Date
Name
Owned For
Owner Type
Purchase Details
Closed on
Mar 31, 2011
Sold by
Parsons Gloria J
Bought by
Gloucester City Of
Current Estimated Value
Purchase Details
Closed on
Apr 23, 2009
Sold by
Parsons Gloria Jean
Bought by
Parsons Gloria Jean
Purchase Details
Closed on
Jul 28, 2004
Sold by
Parsons Gloria Jean and Stanton Margaret A
Bought by
Parsons Gloria Jean
Create a Home Valuation Report for This Property
The Home Valuation Report is an in-depth analysis detailing your home's value as well as a comparison with similar homes in the area
Home Values in the Area
Average Home Value in this Area
Purchase History
| Date | Buyer | Sale Price | Title Company |
|---|---|---|---|
| Gloucester City Of | $1,628 | -- | |
| Parsons Gloria Jean | -- | -- | |
| Parsons Gloria Jean | -- | -- |
Source: Public Records
Tax History
| Year | Tax Paid | Tax Assessment Tax Assessment Total Assessment is a certain percentage of the fair market value that is determined by local assessors to be the total taxable value of land and additions on the property. | Land | Improvement |
|---|---|---|---|---|
| 2025 | $8,008 | $823,900 | $208,800 | $615,100 |
| 2024 | $7,983 | $820,500 | $198,900 | $621,600 |
| 2023 | $7,696 | $726,700 | $177,600 | $549,100 |
| 2022 | $7,478 | $637,500 | $151,000 | $486,500 |
| 2021 | $2,000 | $160,800 | $137,200 | $23,600 |
| 2020 | $3,682 | $298,600 | $137,200 | $161,400 |
| 2019 | $3,530 | $278,200 | $137,200 | $141,000 |
| 2018 | $3,399 | $262,900 | $137,200 | $125,700 |
| 2017 | $3,296 | $249,900 | $130,700 | $119,200 |
| 2016 | $3,198 | $235,000 | $131,200 | $103,800 |
| 2015 | $3,099 | $227,000 | $131,200 | $95,800 |
Source: Public Records
Map
Nearby Homes
- 197 E Main St Unit 1
- 10 Seaview Rd
- 87 Atlantic Rd Unit 2
- 3 Mondello Square
- 73 Rocky Neck Ave Unit 2
- 60 Rocky Neck Ave Unit 202
- 1 Wonson St
- 5 Wise Place
- 36 Eastern Ave
- 11 Ocean View Dr
- 139A Prospect St
- 15 Raven Ln Unit 15
- 191 Main St Unit 3
- 191 Main St Unit 2A
- 15 Mount Vernon St
- 26 Marina Dr
- 50 Warner St
- 35 Middle St Unit 4
- 19 Trask St Unit 2
- 33 Middle St
Your Personal Tour Guide
Ask me questions while you tour the home.