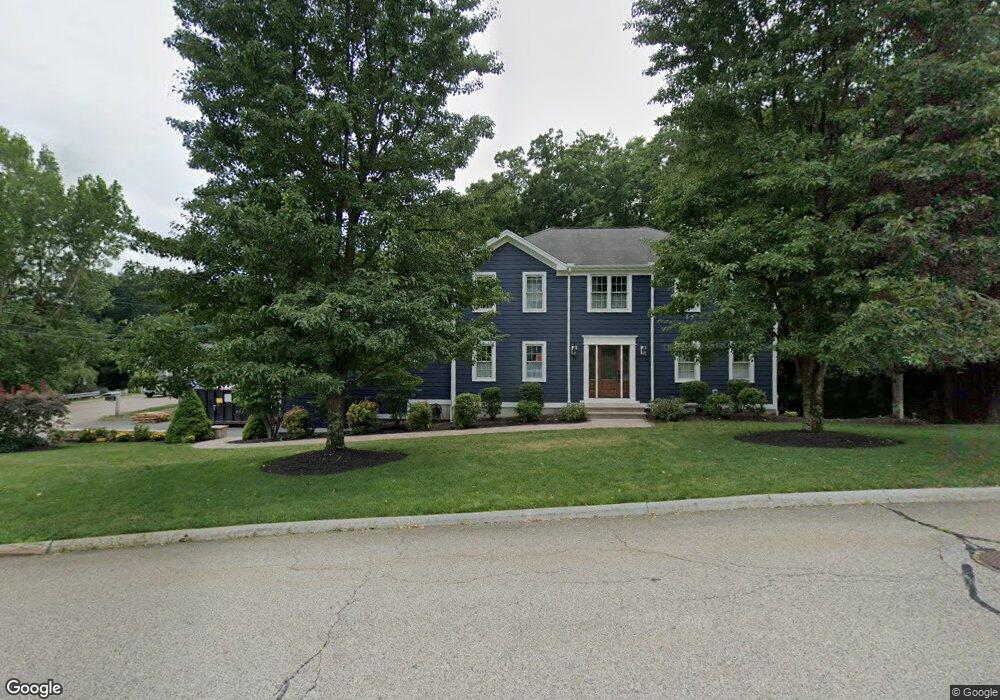
13 Casey Dr Milford, MA 01757
Estimated Value: $735,647 - $849,000
About This Home
This home is located at 13 Casey Dr, Milford, MA 01757 and is currently estimated at $765,412, approximately $288 per square foot. 13 Casey Dr is a home located in Worcester County with nearby schools including Milford High School and Bethany Christian Academy.
Ownership History
We collect this data history from publicly available records. To have your information removed, we recommend requesting removal directly through your county’s website.
Purchase Details
Home Financials for this Owner
Home Financials are based on the most recent Mortgage that was taken out on this home.Home Values in the Area
Average Home Value in this Area
Purchase History
We collect this data history from publicly available records. To have your information removed, we recommend requesting removal directly through your county’s website.
| Date | Buyer | Sale Price | Title Company |
|---|---|---|---|
| $429,900 | -- |
Mortgage History
We collect this data history from publicly available records. To have your information removed, we recommend requesting removal directly through your county’s website.
| Date | Status | Borrower | Loan Amount |
|---|---|---|---|
| Open | $322,700 |
Tax History
We collect this data history from publicly available records. To have your information removed, we recommend requesting removal directly through your county’s website.
| Year | Tax Paid | Tax Assessment Tax Assessment Total Assessment is a certain percentage of the fair market value that is determined by local assessors to be the total taxable value of land and additions on the property. | Land | Improvement |
|---|---|---|---|---|
| 2025 | $8,474 | $662,000 | $207,300 | $454,700 |
| 2024 | $8,374 | $630,100 | $199,400 | $430,700 |
| 2023 | $7,851 | $543,300 | $166,000 | $377,300 |
| 2022 | $7,332 | $476,400 | $152,300 | $324,100 |
| 2021 | $7,001 | $438,100 | $152,300 | $285,800 |
| 2020 | $6,911 | $433,000 | $152,300 | $280,700 |
| 2019 | $6,728 | $406,800 | $152,300 | $254,500 |
| 2018 | $6,768 | $408,700 | $154,200 | $254,500 |
| 2017 | $6,588 | $392,400 | $154,200 | $238,200 |
| 2016 | $6,472 | $376,700 | $154,200 | $222,500 |
| 2015 | $6,467 | $368,500 | $154,200 | $214,300 |
Map
- 6 Bear Hill Rd
- 141 Beaver St
- 21 Howard St
- 3 Black Bear Cir Unit 3
- 16 Black Bear Cir Unit 16
- 2 Dino Way Unit 52
- 3 Dino Way Unit 3
- 44 Black Bear Cir Unit 44
- 20 Beaver Pond Rd Unit 20
- 42 Black Bear Cir Unit 40
- 40 Black Bear Cir Unit 40
- 276 Central St
- 7 Howard St
- 30 Whitney St
- 38 Depot St
- 222 S Main St
- 96 S Main St Unit A
- 25 Forest St
- 51 Fruit Street Extension
- 59 Grove St
Ask me questions while you tour the home.