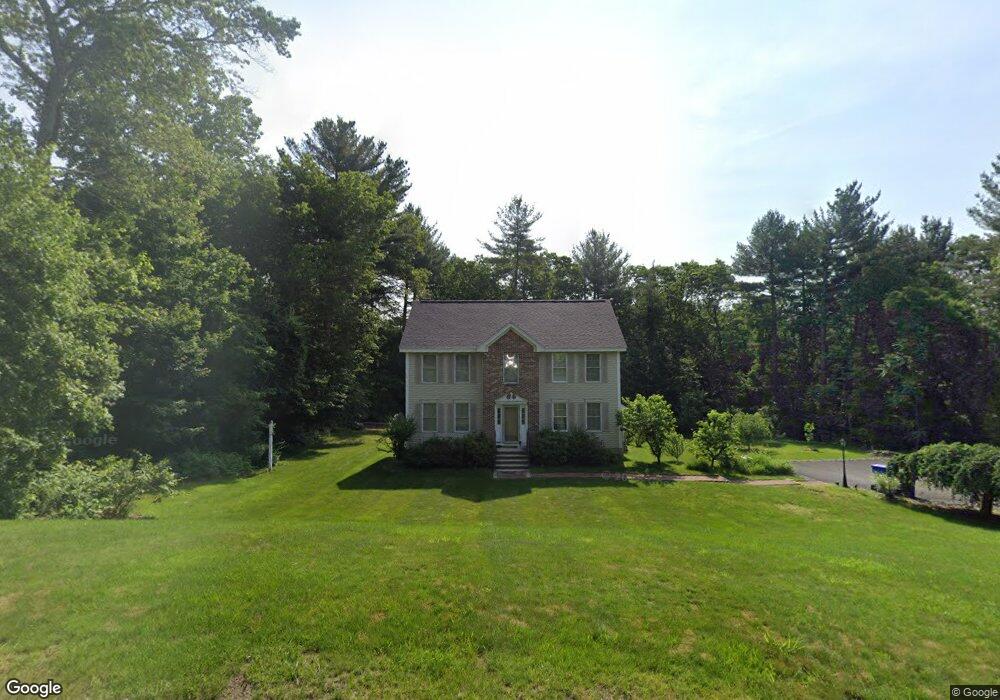
13 Cheshire Ct Londonderry, NH 03053
Estimated Value: $678,000 - $761,000
4
Beds
2
Baths
2,168
Sq Ft
$331/Sq Ft
Est. Value
About This Home
This home is located at 13 Cheshire Ct, Londonderry, NH 03053 and is currently estimated at $718,409, approximately $331 per square foot. 13 Cheshire Ct is a home with nearby schools including Londonderry Middle School, Londonderry Senior High School, and Southern New Hampshire Montessori Academy.
Ownership History
Date
Name
Owned For
Owner Type
Purchase Details
Closed on
Aug 27, 2025
Sold by
Dallahi Driss and Dallahi Jeanne
Bought by
Dallahi Ft and Dallahi
Current Estimated Value
Purchase Details
Closed on
Jul 3, 2003
Sold by
Cusick Christopher C and Cusick Tracey L
Bought by
Dallahi Driss and Dallahi Jeanne
Home Financials for this Owner
Home Financials are based on the most recent Mortgage that was taken out on this home.
Original Mortgage
$246,000
Interest Rate
5.46%
Mortgage Type
Purchase Money Mortgage
Purchase Details
Closed on
Aug 4, 2000
Sold by
One Line Rlty Dev Llc
Bought by
Cusick Christopher C and Cusick Tracey L
Create a Home Valuation Report for This Property
The Home Valuation Report is an in-depth analysis detailing your home's value as well as a comparison with similar homes in the area
Home Values in the Area
Average Home Value in this Area
Purchase History
| Date | Buyer | Sale Price | Title Company |
|---|---|---|---|
| Dallahi Ft | -- | -- | |
| Dallahi Ft | -- | -- | |
| Dallahi Ft | -- | -- | |
| Dallahi Driss | $309,000 | -- | |
| Dallahi Driss | $309,000 | -- | |
| Cusick Christopher C | $227,700 | -- | |
| Cusick Christopher C | $227,700 | -- |
Source: Public Records
Mortgage History
| Date | Status | Borrower | Loan Amount |
|---|---|---|---|
| Previous Owner | Cusick Christopher C | $238,298 | |
| Previous Owner | Cusick Christopher C | $35,000 | |
| Previous Owner | Cusick Christopher C | $246,000 |
Source: Public Records
Tax History Compared to Growth
Tax History
| Year | Tax Paid | Tax Assessment Tax Assessment Total Assessment is a certain percentage of the fair market value that is determined by local assessors to be the total taxable value of land and additions on the property. | Land | Improvement |
|---|---|---|---|---|
| 2024 | $9,642 | $597,400 | $258,500 | $338,900 |
| 2023 | $9,349 | $597,400 | $258,500 | $338,900 |
| 2022 | $8,619 | $466,400 | $194,700 | $271,700 |
| 2021 | $8,572 | $466,400 | $194,700 | $271,700 |
| 2020 | $7,885 | $392,100 | $157,700 | $234,400 |
| 2019 | $7,603 | $392,100 | $157,700 | $234,400 |
| 2018 | $7,179 | $329,300 | $133,800 | $195,500 |
| 2017 | $7,116 | $329,300 | $133,800 | $195,500 |
| 2016 | $7,080 | $329,300 | $133,800 | $195,500 |
| 2015 | $6,922 | $329,300 | $133,800 | $195,500 |
| 2014 | $6,945 | $329,300 | $133,800 | $195,500 |
| 2011 | -- | $341,300 | $133,800 | $207,500 |
Source: Public Records
Map
Nearby Homes