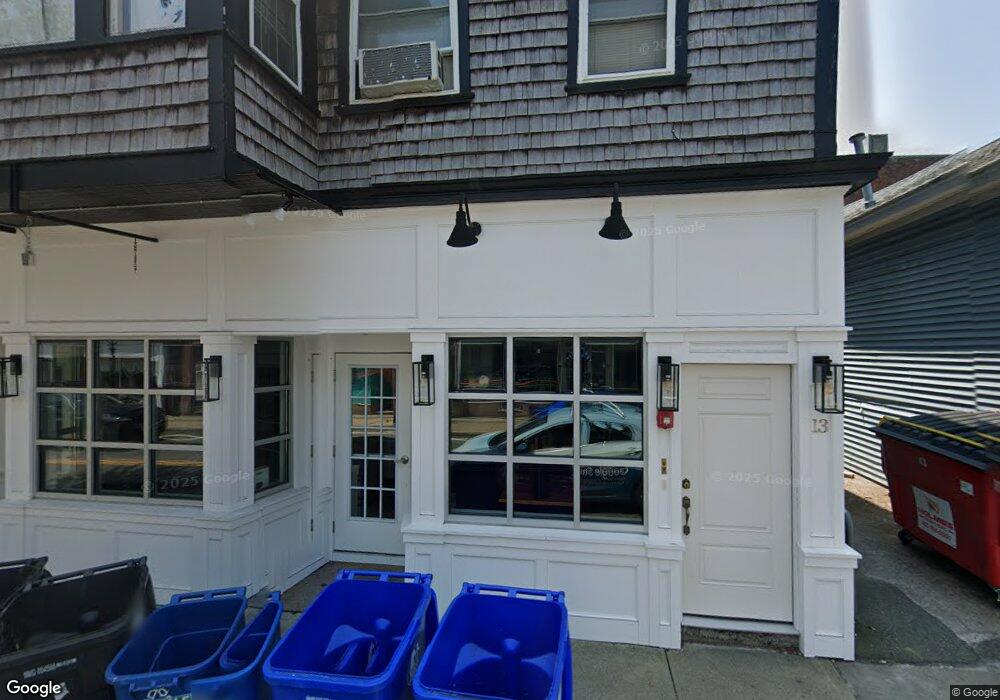
13 Child St Warren, RI 02885
Downtown Warren NeighborhoodEstimated Value: $459,249
4
Beds
4
Baths
1,953
Sq Ft
$235/Sq Ft
Est. Value
About This Home
This home is located at 13 Child St, Warren, RI 02885 and is currently estimated at $459,249, approximately $235 per square foot. 13 Child St is a home located in Bristol County with nearby schools including Mt. Hope High School, Highlander Charter Middle and High School, and East Bay Career Academy.
Ownership History
Date
Name
Owned For
Owner Type
Purchase Details
Closed on
Dec 29, 2020
Sold by
Richardson Michael S
Bought by
Richardson Properties Llc
Current Estimated Value
Home Financials for this Owner
Home Financials are based on the most recent Mortgage that was taken out on this home.
Original Mortgage
$160,000
Outstanding Balance
$140,826
Interest Rate
2.71%
Mortgage Type
New Conventional
Estimated Equity
$318,423
Purchase Details
Closed on
Sep 27, 2013
Sold by
Tomasso Glen A and Banco Papular North Am
Bought by
Richardson Michael S
Purchase Details
Closed on
Oct 26, 2004
Sold by
Mundy Christopher and Mundy Nancy
Bought by
Tomasso Glen
Create a Home Valuation Report for This Property
The Home Valuation Report is an in-depth analysis detailing your home's value as well as a comparison with similar homes in the area
Home Values in the Area
Average Home Value in this Area
Purchase History
| Date | Buyer | Sale Price | Title Company |
|---|---|---|---|
| Richardson Properties Llc | -- | None Available | |
| Richardson Properties Llc | -- | None Available | |
| Richardson Properties Llc | -- | None Available | |
| Richardson Michael S | $101,000 | -- | |
| Richardson Michael S | $101,000 | -- | |
| Tomasso Glen | $230,000 | -- | |
| Tomasso Glen | $230,000 | -- |
Source: Public Records
Mortgage History
| Date | Status | Borrower | Loan Amount |
|---|---|---|---|
| Open | Richardson Properties Llc | $160,000 | |
| Closed | Richardson Properties Llc | $160,000 | |
| Previous Owner | Tomasso Glen | $187,500 | |
| Previous Owner | Tomasso Glen | $10,000 |
Source: Public Records
Tax History
| Year | Tax Paid | Tax Assessment Tax Assessment Total Assessment is a certain percentage of the fair market value that is determined by local assessors to be the total taxable value of land and additions on the property. | Land | Improvement |
|---|---|---|---|---|
| 2025 | $7,071 | $474,900 | $105,200 | $369,700 |
| 2024 | $6,858 | $474,900 | $105,200 | $369,700 |
| 2023 | $6,487 | $474,900 | $105,200 | $369,700 |
| 2022 | $5,441 | $302,100 | $92,000 | $210,100 |
| 2021 | $5,353 | $302,100 | $92,000 | $210,100 |
| 2020 | $5,244 | $302,100 | $92,000 | $210,100 |
| 2019 | $5,571 | $291,500 | $90,200 | $201,300 |
| 2018 | $5,498 | $291,500 | $90,200 | $201,300 |
| 2017 | $5,483 | $291,500 | $90,200 | $201,300 |
| 2016 | $5,366 | $268,700 | $86,400 | $182,300 |
| 2015 | $5,366 | $268,700 | $86,400 | $182,300 |
| 2014 | $5,393 | $268,700 | $86,400 | $182,300 |
Source: Public Records
Map
Nearby Homes
- 31 Child St
- 21 Federal St
- 115 Market St
- 37 Warren Ave
- 69 Cutler St
- 13 Kelly St
- 10 Jesse Davis Ln
- 367 Child St
- 388 Child St
- 74 Adams Point Rd
- 22 Lantern Ln
- 51 Hawthorne Ave
- 11 Mathewson Rd
- 596 Metacom Ave
- 0 Lillis Ave
- 9 Lillis Ave
- 39 Bagy Wrinkle Cove
- 35 Bagy Wrinkle Cove
- 20 Reservoir Ave
- 2 Bagy Wrinkle Cove
Your Personal Tour Guide
Ask me questions while you tour the home.