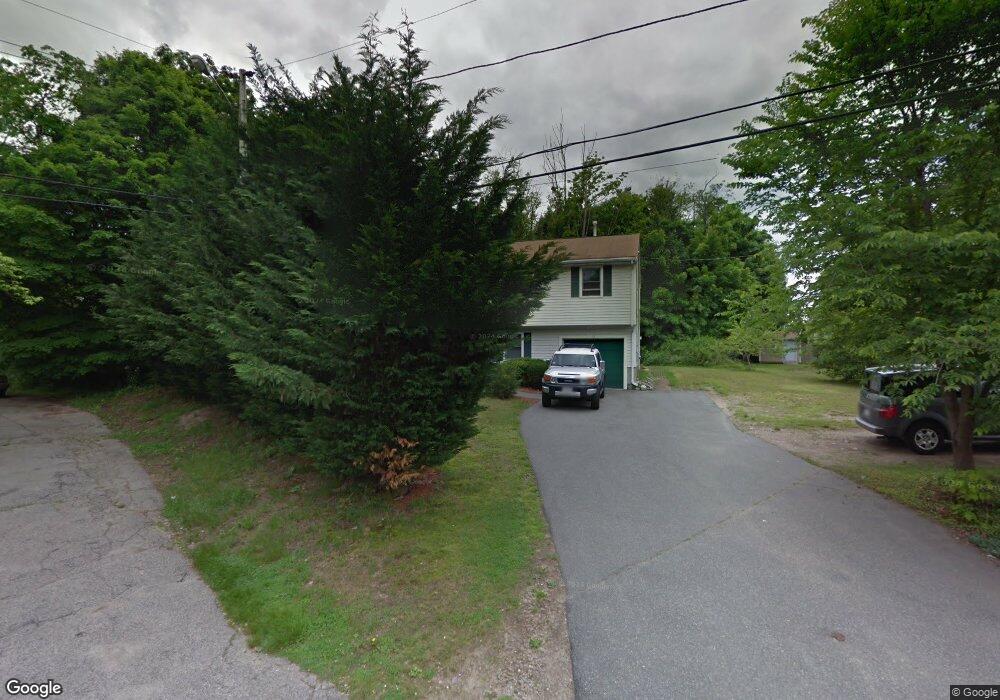
13 Clark St Randolph, MA 02368
North Randolph NeighborhoodEstimated Value: $570,000 - $730,000
3
Beds
3
Baths
1,386
Sq Ft
$458/Sq Ft
Est. Value
About This Home
This home is located at 13 Clark St, Randolph, MA 02368 and is currently estimated at $634,906, approximately $458 per square foot. 13 Clark St is a home located in Norfolk County with nearby schools including Randolph High School, Boston Higashi School, and Lighthouse Baptist Christian Academy.
Ownership History
Date
Name
Owned For
Owner Type
Purchase Details
Closed on
May 5, 2023
Sold by
Kwong Ming H and Kwong Pui W
Bought by
Kwong Ming H and Kwong Melanie
Current Estimated Value
Purchase Details
Closed on
Jan 29, 1999
Sold by
K & B Dev Corp
Bought by
Kwong Ming H and Kwong Pui W
Create a Home Valuation Report for This Property
The Home Valuation Report is an in-depth analysis detailing your home's value as well as a comparison with similar homes in the area
Home Values in the Area
Average Home Value in this Area
Purchase History
| Date | Buyer | Sale Price | Title Company |
|---|---|---|---|
| Kwong Ming H | -- | None Available | |
| Kwong Ming H | $206,000 | -- |
Source: Public Records
Tax History
| Year | Tax Paid | Tax Assessment Tax Assessment Total Assessment is a certain percentage of the fair market value that is determined by local assessors to be the total taxable value of land and additions on the property. | Land | Improvement |
|---|---|---|---|---|
| 2025 | $6,887 | $593,200 | $239,000 | $354,200 |
| 2024 | $6,757 | $590,100 | $234,400 | $355,700 |
| 2023 | $6,584 | $545,000 | $213,100 | $331,900 |
| 2022 | $6,347 | $466,700 | $177,600 | $289,100 |
| 2021 | $6,140 | $415,400 | $148,000 | $267,400 |
| 2020 | $5,955 | $399,400 | $148,000 | $251,400 |
| 2019 | $5,878 | $392,400 | $141,000 | $251,400 |
| 2018 | $5,768 | $363,200 | $128,200 | $235,000 |
| 2017 | $5,508 | $340,400 | $122,200 | $218,200 |
| 2016 | $5,365 | $308,500 | $111,200 | $197,300 |
| 2015 | $5,249 | $290,000 | $106,000 | $184,000 |
Source: Public Records
Map
Nearby Homes
- 591 N Main St
- 34 Orchard St
- 20 Simmonds Blvd Unit 20
- 18 Simmonds Blvd Unit 18
- 8 Simmonds Blvd Unit 8
- 22 Simmonds Blvd Unit 22
- 10 Simmonds Blvd Unit 10
- 24 Simmonds Blvd Unit 24
- 6 Simmonds Blvd Unit 6
- 54 Jasper Ln
- 16 Grove Square Unit 16
- 43 West St Unit A2
- 153 West St
- 875 N Main St
- 43 Emily Jeffers Rd
- 469 North St
- 72 Canton St
- 51 Himoor Cir
- 17 Mazzeo Dr
- 9 Royal Crest Dr Unit 12
Your Personal Tour Guide
Ask me questions while you tour the home.