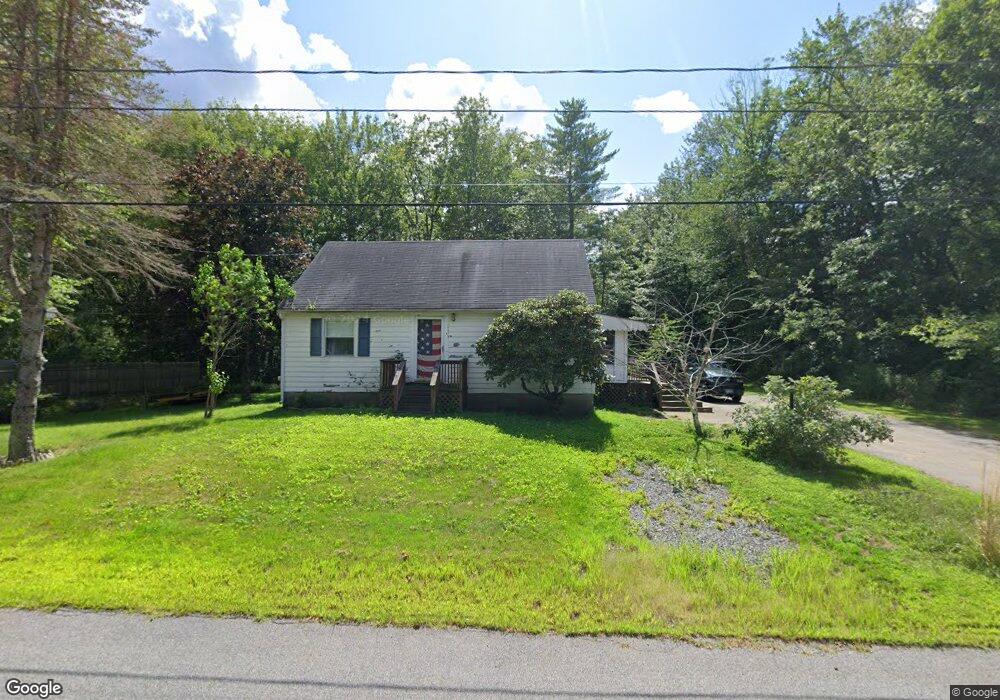
13 Dixon Ave Newfields, NH 03856
Estimated Value: $352,828 - $507,000
2
Beds
1
Bath
1,151
Sq Ft
$368/Sq Ft
Est. Value
About This Home
This home is located at 13 Dixon Ave, Newfields, NH 03856 and is currently estimated at $423,457, approximately $367 per square foot. 13 Dixon Ave is a home located in Rockingham County with nearby schools including Cooperative Middle School, Exeter High School, and Cornerstone Christian Academy.
Ownership History
Date
Name
Owned For
Owner Type
Purchase Details
Closed on
May 24, 2023
Sold by
Bacon Richard S and Bacon Ann P
Bought by
Ellison Robinson E
Current Estimated Value
Purchase Details
Closed on
Mar 20, 2023
Sold by
Williams Elaine B Est and Ellison
Bought by
Ellison Robinson E
Create a Home Valuation Report for This Property
The Home Valuation Report is an in-depth analysis detailing your home's value as well as a comparison with similar homes in the area
Home Values in the Area
Average Home Value in this Area
Purchase History
| Date | Buyer | Sale Price | Title Company |
|---|---|---|---|
| Ellison Robinson E | $250,000 | None Available | |
| Ellison Robinson E | -- | None Available |
Source: Public Records
Tax History Compared to Growth
Tax History
| Year | Tax Paid | Tax Assessment Tax Assessment Total Assessment is a certain percentage of the fair market value that is determined by local assessors to be the total taxable value of land and additions on the property. | Land | Improvement |
|---|---|---|---|---|
| 2024 | $5,673 | $352,600 | $187,200 | $165,400 |
| 2023 | $5,542 | $351,000 | $187,200 | $163,800 |
| 2022 | $5,121 | $244,300 | $132,500 | $111,800 |
| 2021 | $5,020 | $244,300 | $132,500 | $111,800 |
| 2020 | $5,189 | $244,300 | $132,500 | $111,800 |
| 2019 | $5,030 | $244,300 | $132,500 | $111,800 |
| 2018 | $4,778 | $240,700 | $128,900 | $111,800 |
| 2017 | $5,147 | $215,000 | $128,900 | $86,100 |
| 2016 | $5,085 | $219,000 | $128,900 | $90,100 |
| 2015 | $5,044 | $219,000 | $128,900 | $90,100 |
| 2014 | $5,311 | $219,000 | $128,900 | $90,100 |
| 2013 | $5,317 | $219,000 | $128,900 | $90,100 |
Source: Public Records
Map
Nearby Homes
- 11 Old Lee Rd
- 104 Piscassic Rd
- 3 Swamscott St
- 9 Swamscott St
- 156 Piscassic Rd
- 00 Piscassic & Oaklands Rd Unit 1
- 30 Honeycomb Way
- 85 College Rd
- 16 Runaway Rd
- 8 Stonewall Way
- 29 Hamel Farm Dr
- 325 Lita Ln
- 4 Sloans Brook Dr
- 5 Stone Ridge Ln
- 60 Peninsula Dr
- 0 Pear Tree Ln Unit 9
- 0 Pear Tree Ln Unit 10
- 24 Lilac Ln
- 411 Ash Swamp Rd
- 23 Winding Brook Dr