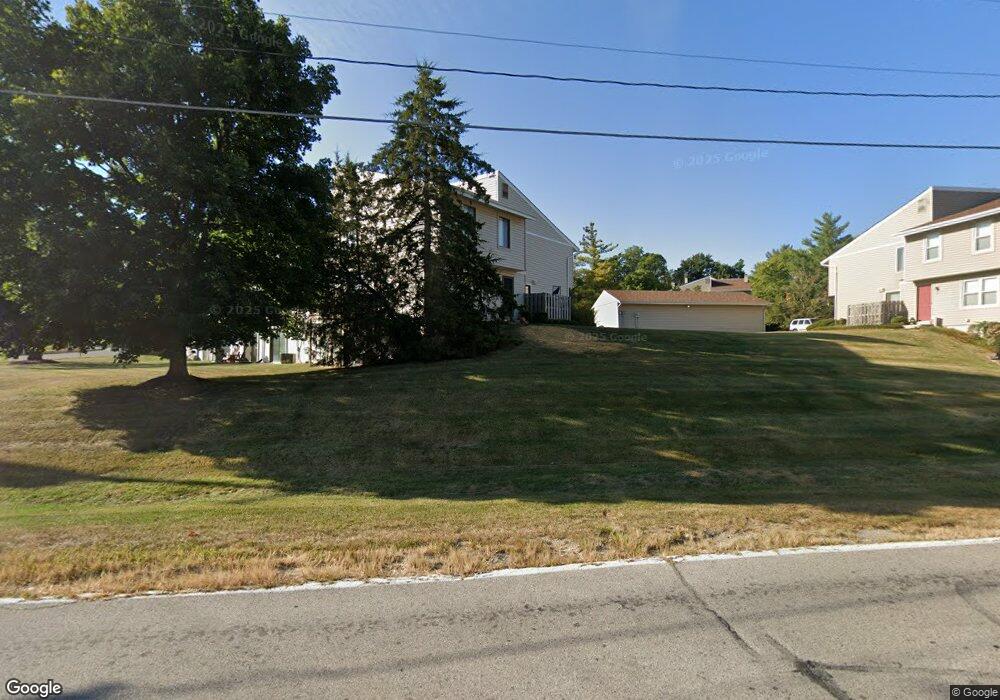
13 Dixons Ct O Fallon, MO 63366
Estimated Value: $165,245 - $179,000
2
Beds
2
Baths
920
Sq Ft
$188/Sq Ft
Est. Value
About This Home
This home is located at 13 Dixons Ct, O Fallon, MO 63366 and is currently estimated at $173,311, approximately $188 per square foot. 13 Dixons Ct is a home located in St. Charles County with nearby schools including Joseph L. Mudd Elementary School, Forest Park Elementary School, and Fort Zumwalt North Middle School.
Ownership History
Date
Name
Owned For
Owner Type
Purchase Details
Closed on
Jan 21, 2025
Sold by
Mccann Family Trust and Mccann Dennis M
Bought by
Marie Holdings Llc
Current Estimated Value
Home Financials for this Owner
Home Financials are based on the most recent Mortgage that was taken out on this home.
Original Mortgage
$272,000
Outstanding Balance
$270,033
Interest Rate
6.6%
Mortgage Type
New Conventional
Estimated Equity
-$96,722
Purchase Details
Closed on
Nov 1, 2023
Sold by
Mccann Dennis M and Mccann Velma H
Bought by
Mccann Family Trust
Purchase Details
Closed on
Mar 2, 2015
Sold by
Mccann Dennis and Mccann Velma H
Bought by
Mccann Dennis M and Mccann Velma H
Purchase Details
Closed on
Nov 14, 2003
Sold by
Freeman Jeffrey K and Freeman Mary Elizabeth
Bought by
Mccann Dennis
Purchase Details
Closed on
May 4, 2000
Sold by
Kelley Martha A
Bought by
Marler Thomas J and Marler Sue A
Create a Home Valuation Report for This Property
The Home Valuation Report is an in-depth analysis detailing your home's value as well as a comparison with similar homes in the area
Home Values in the Area
Average Home Value in this Area
Purchase History
| Date | Buyer | Sale Price | Title Company |
|---|---|---|---|
| Marie Holdings Llc | -- | Investors Title | |
| Mccann Family Trust | -- | None Listed On Document | |
| Mccann Dennis M | -- | None Available | |
| Mccann Dennis | $78,000 | -- | |
| Marler Thomas J | -- | -- |
Source: Public Records
Mortgage History
| Date | Status | Borrower | Loan Amount |
|---|---|---|---|
| Open | Marie Holdings Llc | $272,000 |
Source: Public Records
Tax History
| Year | Tax Paid | Tax Assessment Tax Assessment Total Assessment is a certain percentage of the fair market value that is determined by local assessors to be the total taxable value of land and additions on the property. | Land | Improvement |
|---|---|---|---|---|
| 2025 | $1,488 | $26,141 | -- | -- |
| 2023 | $1,489 | $22,743 | $0 | $0 |
| 2022 | $1,289 | $18,330 | $0 | $0 |
| 2021 | $1,332 | $18,330 | $0 | $0 |
| 2020 | $1,233 | $16,505 | $0 | $0 |
| 2019 | $1,236 | $16,505 | $0 | $0 |
| 2018 | $991 | $12,573 | $0 | $0 |
| 2017 | $964 | $12,573 | $0 | $0 |
| 2016 | $953 | $12,381 | $0 | $0 |
| 2015 | $879 | $12,381 | $0 | $0 |
| 2014 | -- | $14,461 | $0 | $0 |
Source: Public Records
Map
Nearby Homes
- 503 Imperial Ct
- 423 Woodlawn Ave
- 205 E Elm St
- 24 Hawthorne Ct
- 731 Cordes St
- 734 Sunset Ln
- 0 Montbrook Dr
- 203 Saint Margaret Ln
- 309 E Pitman St
- 201 Allen Dr
- 6 S Boxwood Ln
- 409 Saint Joseph Ave
- 6 Emerson Ct
- 508 Saint Christopher Dr
- 1102 Danielle Elizabeth Ct
- 38 Downing St
- 151 N Wellington St
- 31 Piepers Glen Ct
- 805 Saint Joseph Ave
- 4 Shinnecock Hills
Your Personal Tour Guide
Ask me questions while you tour the home.