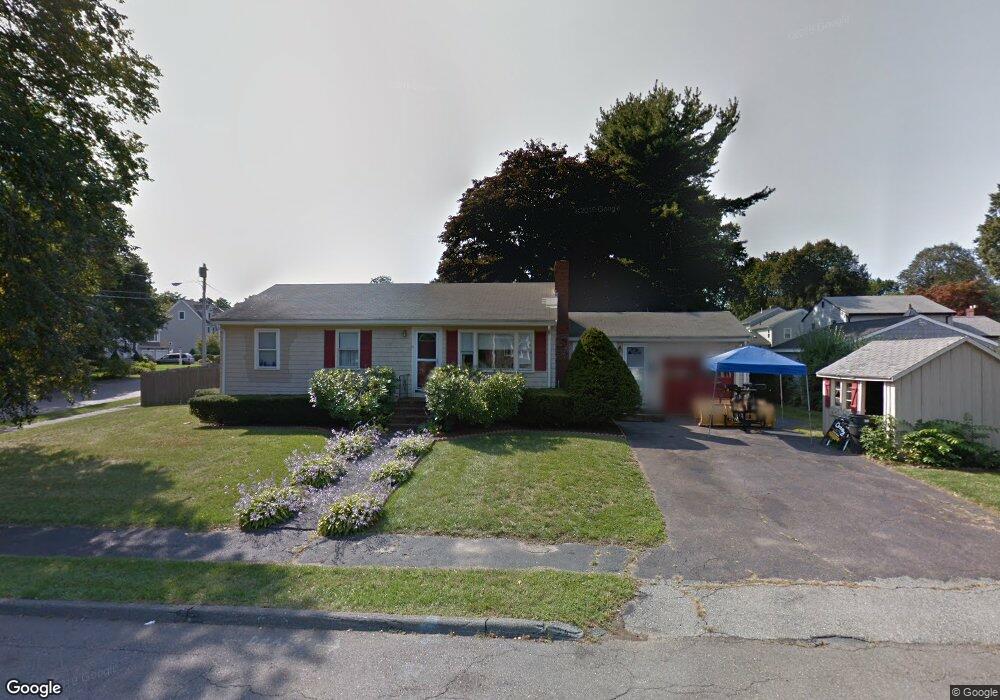
13 Donegal Cir Danvers, MA 01923
Estimated Value: $666,000 - $690,000
3
Beds
3
Baths
1,776
Sq Ft
$384/Sq Ft
Est. Value
About This Home
This home is located at 13 Donegal Cir, Danvers, MA 01923 and is currently estimated at $681,983, approximately $383 per square foot. 13 Donegal Cir is a home located in Essex County with nearby schools including Danvers High School, St. Mary of the Annunciation School, and St. John's Prep.
Ownership History
Date
Name
Owned For
Owner Type
Purchase Details
Closed on
May 3, 2019
Sold by
Hazel Rt and Kokoras
Bought by
Hazel Marilyn
Current Estimated Value
Home Financials for this Owner
Home Financials are based on the most recent Mortgage that was taken out on this home.
Original Mortgage
$250,400
Outstanding Balance
$216,941
Interest Rate
4.2%
Mortgage Type
New Conventional
Estimated Equity
$465,042
Purchase Details
Closed on
Sep 12, 2017
Sold by
Hazel Ret and Hazel
Bought by
Hazel Ret and Kokoras
Purchase Details
Closed on
Jul 23, 2010
Sold by
Hazel Marilyn
Bought by
Hazel Rt and Hazel
Purchase Details
Closed on
May 29, 1987
Sold by
Thomson Gordon
Bought by
Hazel Marilyn
Purchase Details
Closed on
Jan 20, 1987
Sold by
Mackey Vincent
Bought by
Thomson Gordon
Create a Home Valuation Report for This Property
The Home Valuation Report is an in-depth analysis detailing your home's value as well as a comparison with similar homes in the area
Home Values in the Area
Average Home Value in this Area
Purchase History
We collect this data history from publicly available records. To have your information removed, we recommend requesting removal directly through your county’s website.
| Date | Buyer | Sale Price | Title Company |
|---|---|---|---|
| Hazel Marilyn | -- | -- | |
| Hazel Marilyn E | -- | -- | |
| Hazel Jared | $313,000 | -- | |
| Hazel Jared P | $313,000 | -- | |
| Hazel Ret | -- | -- | |
| Hazel Ret | -- | -- | |
| Hazel Rt | -- | -- | |
| Hazel Rt | -- | -- | |
| Hazel Marilyn | $179,900 | -- | |
| Thomson Gordon | $189,000 | -- |
Source: Public Records
Mortgage History
We collect this data history from publicly available records. To have your information removed, we recommend requesting removal directly through your county’s website.
| Date | Status | Borrower | Loan Amount |
|---|---|---|---|
| Open | Hazel Jared P | $250,400 | |
| Closed | Hazel Jared P | $250,400 | |
| Previous Owner | Thomson Gordon | $147,000 | |
| Previous Owner | Thomson Gordon | $21,000 |
Source: Public Records
Tax History
| Year | Tax Paid | Tax Assessment Tax Assessment Total Assessment is a certain percentage of the fair market value that is determined by local assessors to be the total taxable value of land and additions on the property. | Land | Improvement |
|---|---|---|---|---|
| 2025 | $5,992 | $545,200 | $340,500 | $204,700 |
| 2024 | $5,979 | $538,200 | $340,500 | $197,700 |
| 2023 | $5,835 | $496,600 | $309,400 | $187,200 |
| 2022 | $5,707 | $450,800 | $280,800 | $170,000 |
| 2021 | $5,459 | $408,900 | $266,000 | $142,900 |
| 2020 | $5,300 | $405,800 | $262,900 | $142,900 |
| 2019 | $5,072 | $381,900 | $239,000 | $142,900 |
| 2018 | $4,914 | $362,900 | $236,600 | $126,300 |
| 2017 | $4,700 | $331,200 | $206,700 | $124,500 |
| 2016 | $4,479 | $315,400 | $197,100 | $118,300 |
| 2015 | $4,290 | $287,700 | $179,200 | $108,500 |
Source: Public Records
Map
Nearby Homes
- 22 Burley St
- 53 Summer St
- 4 Alden St Unit 3
- 37 Princeton St
- 180 Conant Conant St
- 8 Putnam St Unit 3
- 103 Wenham St
- 12 Wildwood Rd
- 19 Edmunds Cove
- 66 Lawrence St
- 130 Pine St
- 6 Jersey Ln
- 6 Adams St
- 4 Enon Rd
- 45 Abington Rd Unit 45
- 95 Abington Rd Unit 95
- 162 High St Unit B
- 166 High St
- 27 Garfield Ave
- 64 Amherst Rd
Your Personal Tour Guide
Ask me questions while you tour the home.