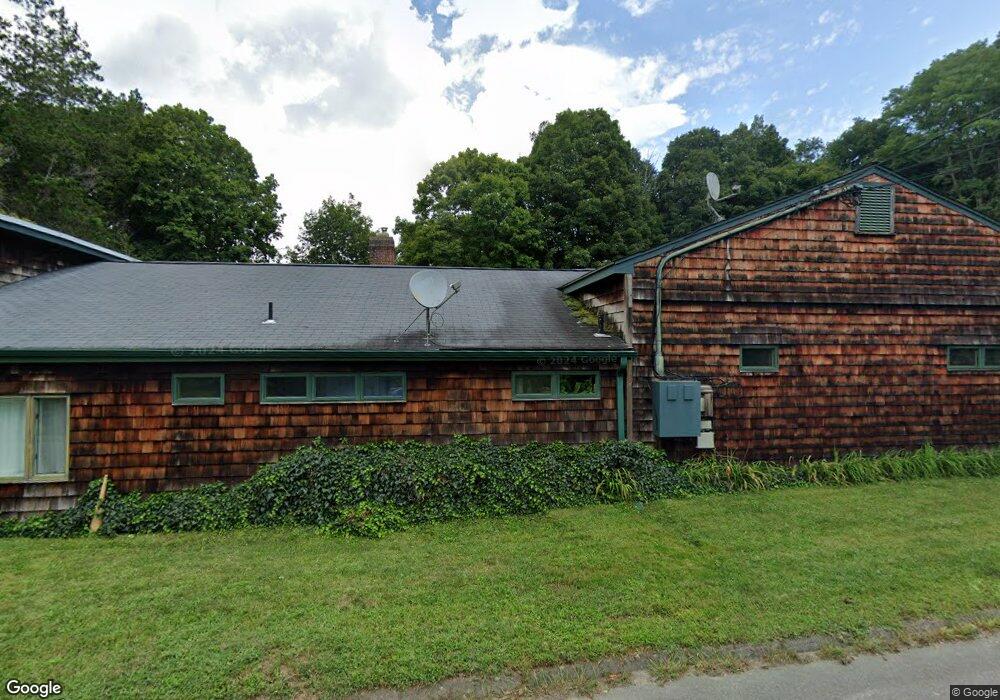
13 Edgewood Ave Ivoryton, CT 06442
Estimated Value: $453,000 - $498,000
3
Beds
2
Baths
1,320
Sq Ft
$362/Sq Ft
Est. Value
About This Home
This home is located at 13 Edgewood Ave, Ivoryton, CT 06442 and is currently estimated at $478,414, approximately $362 per square foot. 13 Edgewood Ave is a home located in Middlesex County with nearby schools including Valley Regional High School.
Ownership History
Date
Name
Owned For
Owner Type
Purchase Details
Closed on
Mar 26, 2024
Sold by
Cutler Orrin L and Cutler Diana M
Bought by
Lafond Kristen and Henry Amanda
Current Estimated Value
Purchase Details
Closed on
Aug 13, 1974
Bought by
Cutler Orrin L and Cutler Diana M
Create a Home Valuation Report for This Property
The Home Valuation Report is an in-depth analysis detailing your home's value as well as a comparison with similar homes in the area
Home Values in the Area
Average Home Value in this Area
Purchase History
| Date | Buyer | Sale Price | Title Company |
|---|---|---|---|
| Lafond Kristen | -- | None Available | |
| Lafond Kristen | -- | None Available | |
| Cutler Orrin L | -- | -- |
Source: Public Records
Mortgage History
| Date | Status | Borrower | Loan Amount |
|---|---|---|---|
| Previous Owner | Cutler Orrin L | $50,000 | |
| Previous Owner | Cutler Orrin L | $15,000 | |
| Previous Owner | Cutler Orrin L | $56,500 | |
| Previous Owner | Cutler Orrin L | $36,000 |
Source: Public Records
Tax History Compared to Growth
Tax History
| Year | Tax Paid | Tax Assessment Tax Assessment Total Assessment is a certain percentage of the fair market value that is determined by local assessors to be the total taxable value of land and additions on the property. | Land | Improvement |
|---|---|---|---|---|
| 2025 | $5,134 | $275,600 | $60,600 | $215,000 |
| 2024 | $4,975 | $275,600 | $60,600 | $215,000 |
| 2023 | $4,050 | $179,300 | $53,800 | $125,500 |
| 2022 | $4,061 | $179,300 | $53,800 | $125,500 |
| 2021 | $4,022 | $179,300 | $53,800 | $125,500 |
| 2020 | $3,911 | $179,300 | $53,800 | $125,500 |
| 2019 | $3,882 | $179,300 | $53,800 | $125,500 |
| 2018 | $3,752 | $171,700 | $56,700 | $115,000 |
| 2017 | $3,771 | $171,700 | $56,700 | $115,000 |
| 2016 | $3,705 | $171,700 | $56,700 | $115,000 |
| 2015 | $3,619 | $171,700 | $56,700 | $115,000 |
| 2014 | $3,604 | $171,700 | $56,700 | $115,000 |
Source: Public Records
Map
Nearby Homes
- 0 Fairview St
- 15 Cedar St
- 20 Comstock Ave Unit 3D
- 20 Comstock Ave Unit 4C
- 130 Mares Hill Rd
- 33 Deep River Rd
- 130 Dennison Rd
- 41 Bushy Hill Rd
- 214 Kelsey Hill Rd
- 1 Lake Louise Dr
- 179 Bokum Rd
- 86 Bushy Hill Rd
- 35 Prospect St
- 92 Warsaw St
- 60 N Main St
- 13 Maple Ave
- 18 Benson Ln
- 3 Essex Square
- 4 Bank Ln
- 11 N Main St