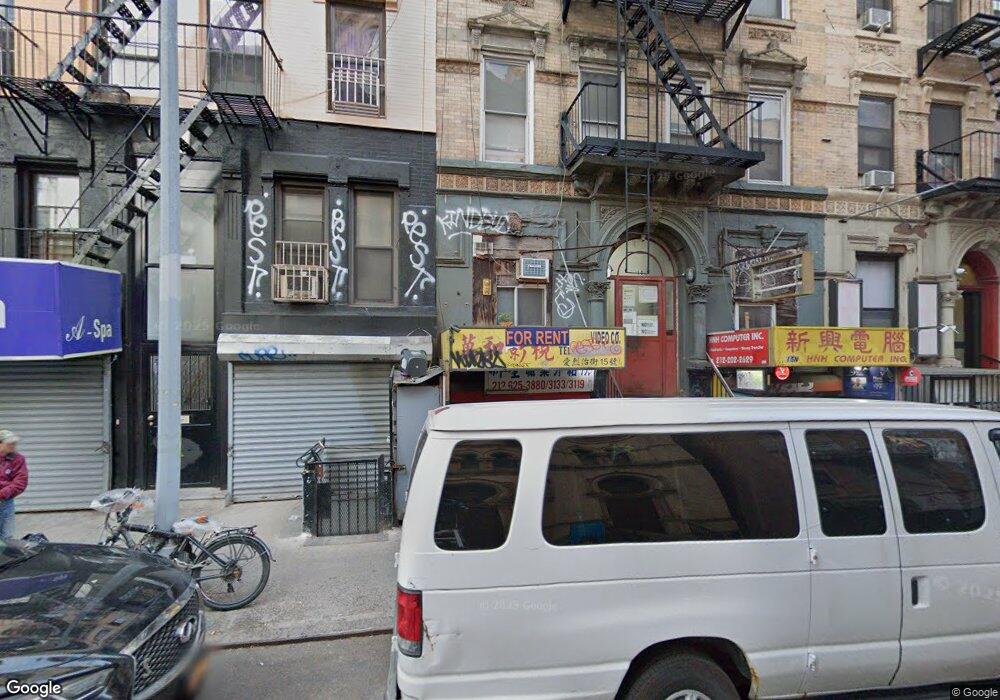
13 Eldridge St Unit 4A New York, NY 10002
Chinatown NeighborhoodEstimated Value: $518,000 - $681,000
--
Bed
--
Bath
449
Sq Ft
$1,344/Sq Ft
Est. Value
About This Home
This home is located at 13 Eldridge St Unit 4A, New York, NY 10002 and is currently estimated at $603,664, approximately $1,344 per square foot. 13 Eldridge St Unit 4A is a home located in New York County with nearby schools including P.S. 2 Meyer London, M.S. 131 Dr. Sun Yat Sen, and Lower Manhattan Community Middle School.
Ownership History
Date
Name
Owned For
Owner Type
Purchase Details
Closed on
Mar 13, 2023
Sold by
Huang Eric and Li Jian Ying
Bought by
Cai Yuzhen
Current Estimated Value
Purchase Details
Closed on
May 28, 2008
Sold by
Gao Chun Kai
Bought by
Huang Eric and Li Jian Ying
Home Financials for this Owner
Home Financials are based on the most recent Mortgage that was taken out on this home.
Original Mortgage
$304,000
Interest Rate
6.13%
Mortgage Type
Purchase Money Mortgage
Purchase Details
Closed on
Jun 11, 2001
Sold by
Lee Mee Kim
Bought by
Gao Chun Kai
Home Financials for this Owner
Home Financials are based on the most recent Mortgage that was taken out on this home.
Original Mortgage
$113,400
Interest Rate
7.14%
Create a Home Valuation Report for This Property
The Home Valuation Report is an in-depth analysis detailing your home's value as well as a comparison with similar homes in the area
Home Values in the Area
Average Home Value in this Area
Purchase History
| Date | Buyer | Sale Price | Title Company |
|---|---|---|---|
| Cai Yuzhen | $490,000 | -- | |
| Huang Eric | $450,000 | -- | |
| Huang Eric | $450,000 | -- | |
| Gao Chun Kai | -- | -- | |
| Gao Chun Kai | -- | -- |
Source: Public Records
Mortgage History
| Date | Status | Borrower | Loan Amount |
|---|---|---|---|
| Previous Owner | Huang Eric | $304,000 | |
| Previous Owner | Gao Chun Kai | $113,400 |
Source: Public Records
Tax History Compared to Growth
Tax History
| Year | Tax Paid | Tax Assessment Tax Assessment Total Assessment is a certain percentage of the fair market value that is determined by local assessors to be the total taxable value of land and additions on the property. | Land | Improvement |
|---|---|---|---|---|
| 2025 | $7,563 | $58,802 | $7,946 | $50,856 |
| 2024 | $7,563 | $60,491 | $7,946 | $52,545 |
| 2023 | $7,097 | $57,851 | $7,946 | $49,905 |
| 2022 | $7,042 | $57,553 | $7,946 | $49,607 |
| 2021 | $7,310 | $59,589 | $7,946 | $51,643 |
| 2020 | $7,224 | $66,392 | $7,946 | $58,446 |
| 2019 | $6,757 | $60,632 | $7,946 | $52,686 |
| 2018 | $6,552 | $62,321 | $7,947 | $54,374 |
| 2017 | $6,018 | $54,624 | $7,946 | $46,678 |
| 2016 | $5,535 | $56,362 | $7,946 | $48,416 |
| 2015 | $2,719 | $48,317 | $7,946 | $40,371 |
| 2014 | $2,719 | $46,727 | $7,946 | $38,781 |
Source: Public Records
Map
Nearby Homes
- 60 Henry St Unit 9D
- 136 E Broadway
- 136 E Broadway Unit PHA
- 50 Bayard St Unit 2R
- 50 Bayard St Unit 2J
- 50 Bayard St Unit 4L
- 50 Bayard St Unit 7W
- 50 Bayard St Unit 6T
- 50 Bayard St Unit 8W
- 7 Essex St Unit 8
- 31 Monroe St Unit 9B
- 55 Hester St Unit 8C
- 6 Chatham Square
- 175 E Broadway Unit 4C
- 175 E Broadway Unit 8-A
- 175 E Broadway Unit 4A
- 175 E Broadway Unit 8-B
- 53 Elizabeth St Unit 4-A
- 330 Grand St Unit 1B
- 330 Grand St Unit 4 B
- 1-3 Eldridge St Unit Store C
- 1-3 Eldridge St Unit 2
- 1-3 Eldridge St Unit 1
- 1-3 Eldridge St Unit A
- 13 Eldridge St Unit 6B
- 13 Eldridge St Unit 5B
- 13 Eldridge St Unit C
- 13 Eldridge St
- 13 Eldridge St Unit 3B
- 13 Eldridge St Unit 6A
- 13 Eldridge St Unit 3A
- 13 Eldridge St Unit 5A
- 13 Eldridge St Unit 4B
- 1 Eldridge St Unit 4A
- 1 Eldridge St Unit 6A3
- 1 Eldridge St Unit 5A3
- 1 Eldridge St Unit 4B3
- 1 Eldridge St Unit 4A3
- 1 Eldridge St Unit 3B3
- 1 Eldridge St Unit 3A3