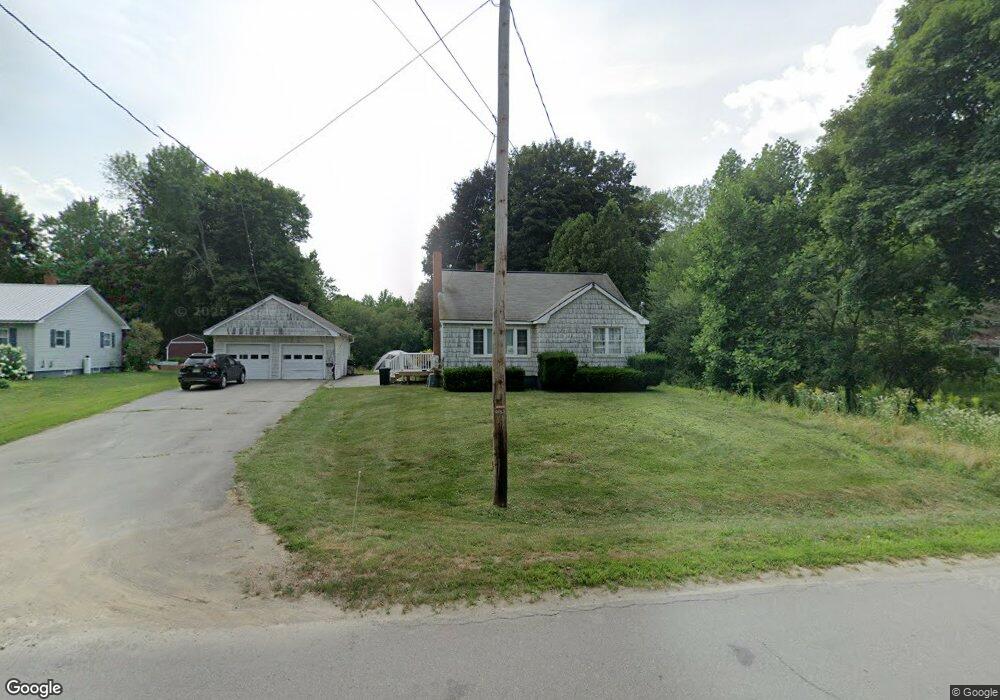
13 Elm St Newport, ME 04953
Estimated Value: $223,000 - $319,000
3
Beds
2
Baths
1,016
Sq Ft
$256/Sq Ft
Est. Value
About This Home
This home is located at 13 Elm St, Newport, ME 04953 and is currently estimated at $259,675, approximately $255 per square foot. 13 Elm St is a home located in Penobscot County with nearby schools including Sebasticook Valley Elementary School and Nokomis Regional Middle School/High School.
Ownership History
Date
Name
Owned For
Owner Type
Purchase Details
Closed on
Aug 10, 2022
Sold by
Curtis Perley R
Bought by
Cook Christopher R and Cook Kailee L
Current Estimated Value
Home Financials for this Owner
Home Financials are based on the most recent Mortgage that was taken out on this home.
Original Mortgage
$159,375
Outstanding Balance
$152,196
Interest Rate
5.7%
Mortgage Type
Purchase Money Mortgage
Estimated Equity
$107,479
Purchase Details
Closed on
Dec 9, 2016
Sold by
Dean Fred A Est and Dean
Bought by
Curtis Perley R
Create a Home Valuation Report for This Property
The Home Valuation Report is an in-depth analysis detailing your home's value as well as a comparison with similar homes in the area
Home Values in the Area
Average Home Value in this Area
Purchase History
| Date | Buyer | Sale Price | Title Company |
|---|---|---|---|
| Cook Christopher R | $212,500 | None Available | |
| Curtis Perley R | -- | -- |
Source: Public Records
Mortgage History
| Date | Status | Borrower | Loan Amount |
|---|---|---|---|
| Open | Cook Christopher R | $159,375 |
Source: Public Records
Tax History Compared to Growth
Tax History
| Year | Tax Paid | Tax Assessment Tax Assessment Total Assessment is a certain percentage of the fair market value that is determined by local assessors to be the total taxable value of land and additions on the property. | Land | Improvement |
|---|---|---|---|---|
| 2024 | $2,896 | $165,500 | $18,800 | $146,700 |
| 2023 | $2,522 | $154,700 | $17,500 | $137,200 |
| 2022 | $2,399 | $122,400 | $13,900 | $108,500 |
| 2021 | $2,408 | $116,900 | $13,200 | $103,700 |
| 2020 | $2,365 | $114,800 | $13,000 | $101,800 |
| 2019 | $2,309 | $108,400 | $12,300 | $96,100 |
| 2018 | $2,309 | $108,400 | $12,300 | $96,100 |
| 2017 | $2,168 | $108,400 | $12,300 | $96,100 |
| 2016 | $2,103 | $108,400 | $12,300 | $96,100 |
| 2015 | $1,940 | $108,400 | $12,300 | $96,100 |
| 2014 | $1,864 | $108,400 | $12,300 | $96,100 |
Source: Public Records
Map
Nearby Homes
- 8 Grove St
- 22 Shaw St
- 49 North St
- 10 Sheridan St
- 107 Barrows Point Rd
- 16 Libby Hill Rd
- 20 Spruce St
- 448 Elm St
- 133 Hart St
- 315 Golf Course Rd
- lot 6 Golf Course Rd Unit Lot 6
- 48 Hart St
- 6 Hurds Corner Rd
- Lot 2 Golf Course Cameo Sub Rd
- lot 5 Golf Course Cameo Sub Rd
- 5 North Rd
- 0000 Ridge Rd
- 107 Shady Ln
- 106 Shady Ln
- 009-007 Lilly Dr