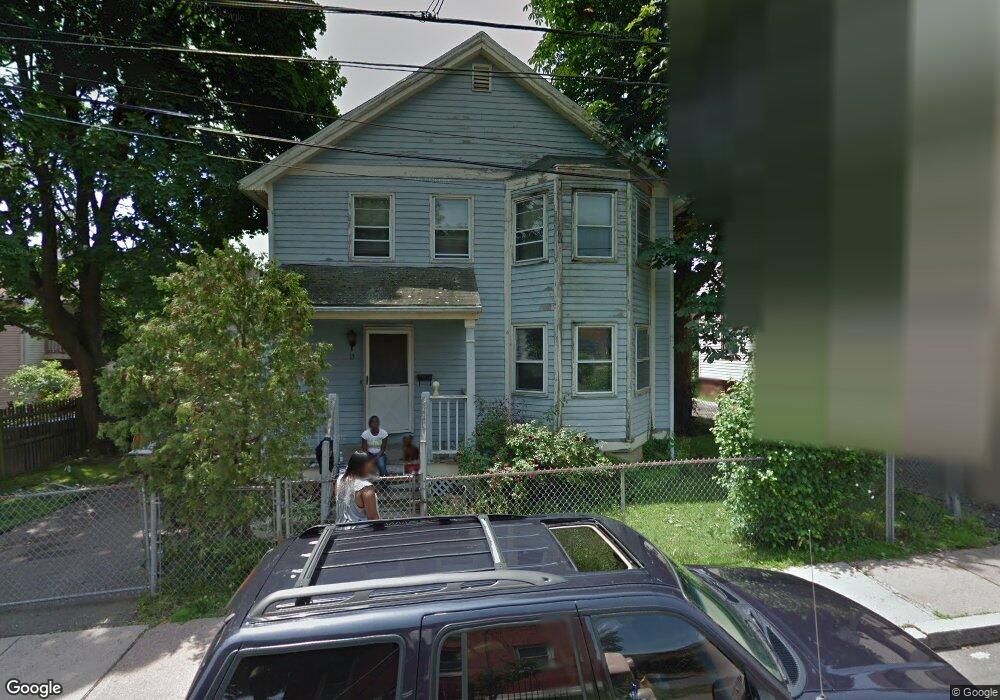
13 Fairmount St Hartford, CT 06120
Clay Arsenal NeighborhoodEstimated Value: $197,053 - $236,000
3
Beds
2
Baths
1,452
Sq Ft
$155/Sq Ft
Est. Value
About This Home
This home is located at 13 Fairmount St, Hartford, CT 06120 and is currently estimated at $224,513, approximately $154 per square foot. 13 Fairmount St is a home located in Hartford County with nearby schools including Capital Preparatory Magnet School, Perry Elementary School, and Ib Global Communications Academy.
Ownership History
Date
Name
Owned For
Owner Type
Purchase Details
Closed on
Nov 12, 2025
Sold by
13 Fairmount St Llc
Bought by
Mccoy Cheree
Current Estimated Value
Home Financials for this Owner
Home Financials are based on the most recent Mortgage that was taken out on this home.
Original Mortgage
$219,450
Outstanding Balance
$219,450
Interest Rate
6.34%
Mortgage Type
New Conventional
Estimated Equity
$5,063
Purchase Details
Closed on
Jun 18, 2021
Sold by
Brooks Cathy
Bought by
13 Fairmount St Llc
Purchase Details
Closed on
Aug 11, 2020
Sold by
Mansfield St Llc
Bought by
Brooks Cathy
Purchase Details
Closed on
May 13, 2015
Sold by
Atfh Real Prpoerty Llc
Bought by
Mansfield Street Llc
Purchase Details
Closed on
Jan 30, 2015
Sold by
Shipman Donita and American Tax Funding L
Bought by
American Tax Funding L
Create a Home Valuation Report for This Property
The Home Valuation Report is an in-depth analysis detailing your home's value as well as a comparison with similar homes in the area
Home Values in the Area
Average Home Value in this Area
Purchase History
| Date | Buyer | Sale Price | Title Company |
|---|---|---|---|
| Mccoy Cheree | $231,000 | -- | |
| 13 Fairmount St Llc | -- | None Available | |
| Brooks Cathy | -- | None Available | |
| Mansfield Street Llc | $8,000 | -- | |
| American Tax Funding L | -- | -- |
Source: Public Records
Mortgage History
| Date | Status | Borrower | Loan Amount |
|---|---|---|---|
| Open | Mccoy Cheree | $219,450 | |
| Previous Owner | American Tax Funding L | $13,129 | |
| Previous Owner | American Tax Funding L | $81,781 |
Source: Public Records
Tax History Compared to Growth
Tax History
| Year | Tax Paid | Tax Assessment Tax Assessment Total Assessment is a certain percentage of the fair market value that is determined by local assessors to be the total taxable value of land and additions on the property. | Land | Improvement |
|---|---|---|---|---|
| 2025 | $3,735 | $54,170 | $2,940 | $51,230 |
| 2024 | $3,735 | $54,170 | $2,940 | $51,230 |
| 2023 | $3,735 | $54,170 | $2,940 | $51,230 |
| 2022 | $3,735 | $54,170 | $2,940 | $51,230 |
| 2021 | $3,294 | $44,345 | $2,625 | $41,720 |
| 2020 | $3,294 | $44,345 | $2,625 | $41,720 |
| 2019 | $3,294 | $44,345 | $2,625 | $41,720 |
| 2018 | $3,183 | $42,850 | $2,537 | $40,313 |
| 2016 | $3,092 | $41,615 | $2,415 | $39,200 |
| 2015 | $2,831 | $38,105 | $2,301 | $35,804 |
| 2014 | $2,762 | $37,173 | $2,245 | $34,928 |
Source: Public Records
Map
Nearby Homes
- 47 Seyms St
- 5 Winter St
- 116 Fairmount St
- 152 Brook St
- 300 Garden St
- 186 Brook St Unit 188
- 410 Garden St
- 183 Brook St Unit 185
- 134 Magnolia St Unit 136
- 59 Magnolia St
- 6 Magnolia St
- 33 Sargeant St
- 62 Burton St
- 68 Enfield St Unit 70
- 67 Enfield St Unit 37
- 10 Burton St Unit 12
- 39 Capen St
- 96 Sargeant St Unit 98
- 270 Bellevue St
- 66 Edgewood St Unit 68
- 15 Fairmount St
- 27 East St
- 27 East St Unit C
- 27 East St Unit D
- 31 East St
- 39 East St Unit 41
- 18 Center St Unit 20
- 14 Fairmount St Unit 16
- 45 East St
- 30 Center St
- 51 East St
- 29 Florence St
- 32 Florence St
- 34 Center St Unit 38
- 17 Center St
- 22 East St Unit 24
- 248 Albany Ave
- 246 Albany Ave
- 30 Florence St
- 27 Florence St