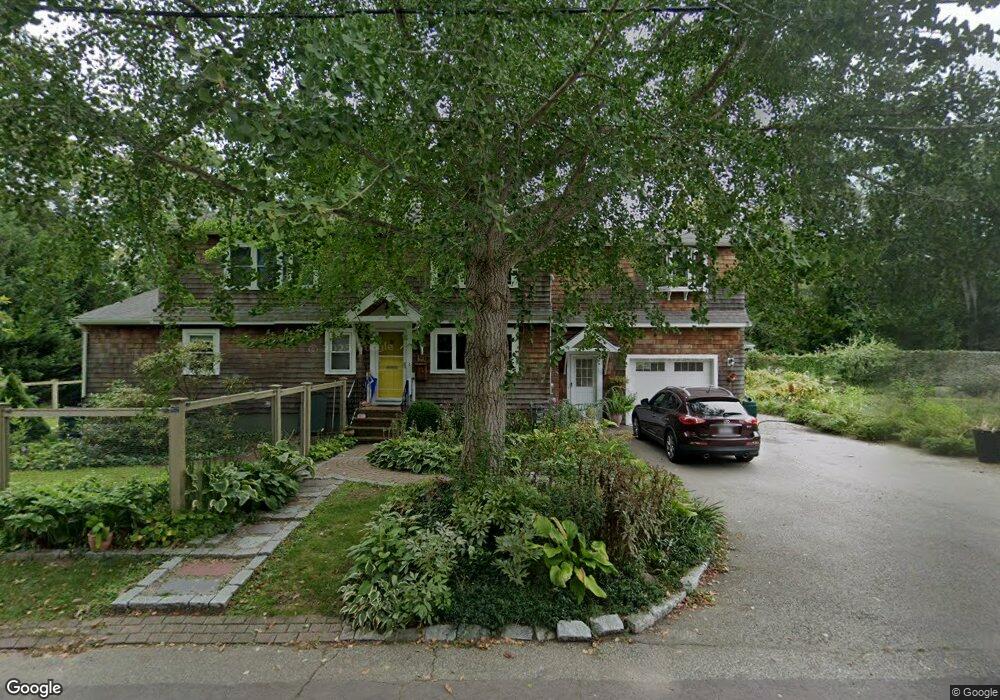
13 Fisher Rd Hingham, MA 02043
Estimated Value: $824,000 - $1,310,381
2
Beds
2
Baths
1,224
Sq Ft
$891/Sq Ft
Est. Value
About This Home
This home is located at 13 Fisher Rd, Hingham, MA 02043 and is currently estimated at $1,090,345, approximately $890 per square foot. 13 Fisher Rd is a home located in Plymouth County with nearby schools including East Elementary School, Hingham Middle School, and Hingham High School.
Ownership History
Date
Name
Owned For
Owner Type
Purchase Details
Closed on
Aug 8, 2008
Sold by
Selinger Ann G
Bought by
Ford Ronald J and Ford Corinna M
Current Estimated Value
Home Financials for this Owner
Home Financials are based on the most recent Mortgage that was taken out on this home.
Original Mortgage
$279,200
Interest Rate
6.49%
Mortgage Type
Purchase Money Mortgage
Purchase Details
Closed on
Sep 28, 2004
Sold by
Robinson Nt
Bought by
Robinson Elizabeth M and Selinger Ann G
Create a Home Valuation Report for This Property
The Home Valuation Report is an in-depth analysis detailing your home's value as well as a comparison with similar homes in the area
Purchase History
| Date | Buyer | Sale Price | Title Company |
|---|---|---|---|
| Ford Ronald J | $349,000 | -- | |
| Robinson Elizabeth M | -- | -- |
Source: Public Records
Mortgage History
| Date | Status | Borrower | Loan Amount |
|---|---|---|---|
| Open | Robinson Elizabeth M | $277,774 | |
| Closed | Robinson Elizabeth M | $285,000 | |
| Closed | Robinson Elizabeth M | $279,200 |
Source: Public Records
Tax History
| Year | Tax Paid | Tax Assessment Tax Assessment Total Assessment is a certain percentage of the fair market value that is determined by local assessors to be the total taxable value of land and additions on the property. | Land | Improvement |
|---|---|---|---|---|
| 2025 | $10,427 | $975,400 | $334,200 | $641,200 |
| 2024 | $9,681 | $892,300 | $334,200 | $558,100 |
| 2023 | $8,172 | $817,200 | $310,300 | $506,900 |
| 2022 | $7,804 | $675,100 | $270,600 | $404,500 |
| 2021 | $7,705 | $653,000 | $270,600 | $382,400 |
| 2020 | $7,529 | $653,000 | $270,600 | $382,400 |
| 2019 | $7,415 | $627,900 | $270,600 | $357,300 |
| 2018 | $4,614 | $627,900 | $270,600 | $357,300 |
| 2017 | $6,864 | $560,300 | $277,300 | $283,000 |
| 2016 | $6,833 | $547,100 | $264,100 | $283,000 |
| 2015 | $6,474 | $516,700 | $233,700 | $283,000 |
Source: Public Records
Map
Nearby Homes
- 114 Hull St
- 166 Hull St
- LOT 1B Rockland St
- 2 Cliff Rd
- 14 Cedarledge Village
- 101 Rockland St
- 130 Forest Ave
- 96 Forest Ave
- 33 Turkey Hill Ln
- 8 Evergreen Ln
- 3 Evergreen Ln
- 2 Woodbine Ln
- 37 Richards Rd
- 82 East St
- 23 Wyola Rd
- 137 Fairoaks Ln
- 155 George Washington Blvd Unit 210
- 65 East St
- 99 Nantasket Ave
- 10 Popes Ln
Your Personal Tour Guide
Ask me questions while you tour the home.