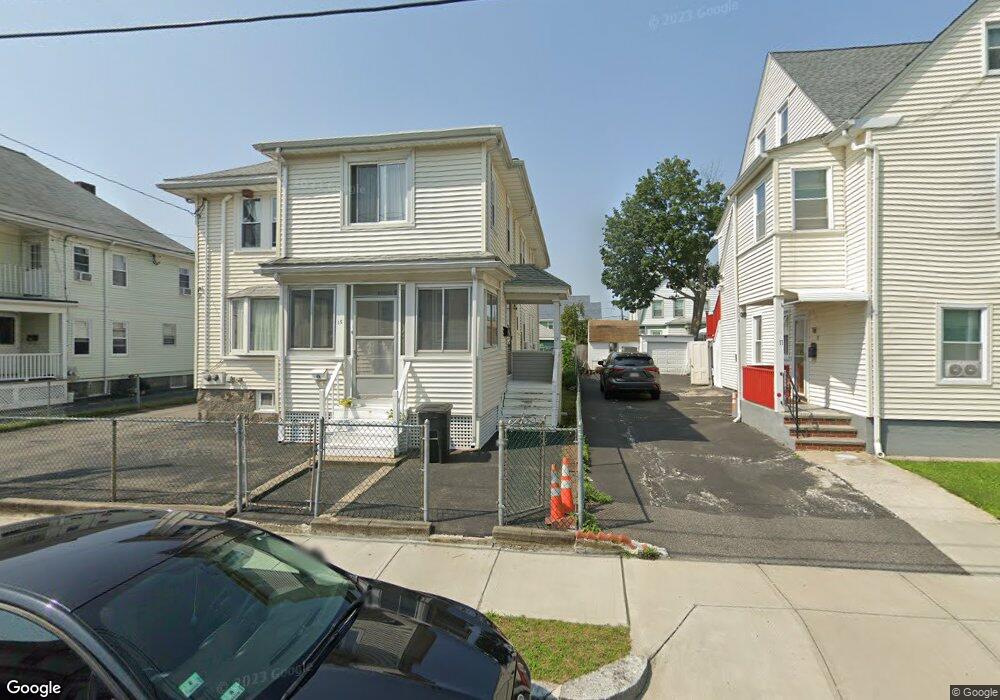
13 Flynt St Quincy, MA 02171
North Quincy NeighborhoodEstimated Value: $867,075 - $1,102,000
6
Beds
2
Baths
2,288
Sq Ft
$432/Sq Ft
Est. Value
About This Home
This home is located at 13 Flynt St, Quincy, MA 02171 and is currently estimated at $988,019, approximately $431 per square foot. 13 Flynt St is a home located in Norfolk County with nearby schools including Francis W. Parker Elementary School, Atlantic Middle School, and North Quincy High School.
Ownership History
Date
Name
Owned For
Owner Type
Purchase Details
Closed on
Jul 15, 1993
Sold by
Tsieh Fung K
Bought by
Wong Wing K and Wong Hui Z
Current Estimated Value
Home Financials for this Owner
Home Financials are based on the most recent Mortgage that was taken out on this home.
Original Mortgage
$124,000
Interest Rate
7.4%
Mortgage Type
Purchase Money Mortgage
Create a Home Valuation Report for This Property
The Home Valuation Report is an in-depth analysis detailing your home's value as well as a comparison with similar homes in the area
Home Values in the Area
Average Home Value in this Area
Purchase History
| Date | Buyer | Sale Price | Title Company |
|---|---|---|---|
| Wong Wing K | $184,000 | -- |
Source: Public Records
Mortgage History
| Date | Status | Borrower | Loan Amount |
|---|---|---|---|
| Closed | Wong Wing K | $124,000 |
Source: Public Records
Tax History
| Year | Tax Paid | Tax Assessment Tax Assessment Total Assessment is a certain percentage of the fair market value that is determined by local assessors to be the total taxable value of land and additions on the property. | Land | Improvement |
|---|---|---|---|---|
| 2025 | $9,772 | $847,500 | $366,000 | $481,500 |
| 2024 | $9,389 | $833,100 | $366,000 | $467,100 |
| 2023 | $8,743 | $785,500 | $332,800 | $452,700 |
| 2022 | $8,284 | $691,500 | $266,200 | $425,300 |
| 2021 | $8,425 | $694,000 | $266,200 | $427,800 |
| 2020 | $8,505 | $684,200 | $261,000 | $423,200 |
| 2019 | $8,165 | $650,600 | $251,000 | $399,600 |
| 2018 | $7,767 | $582,200 | $239,000 | $343,200 |
| 2017 | $7,684 | $542,300 | $217,300 | $325,000 |
| 2016 | $6,624 | $461,300 | $197,500 | $263,800 |
| 2015 | $6,275 | $429,800 | $179,600 | $250,200 |
| 2014 | $5,589 | $376,100 | $179,600 | $196,500 |
Source: Public Records
Map
Nearby Homes
- 20 Ellington Rd
- 17 Holmes St Unit 2
- 17 Holmes St Unit 1
- 85 E Squantum St Unit 10
- 28 Apthorp St
- 39 Fayette St Unit 403
- 10 Weston Ave Unit 322
- 98 Safford St
- 201 Billings St
- 52 Hamilton Ave
- 297 Billings St
- 154 N Central Ave
- 55 Copley St
- 175 Quincy Shore Dr Unit B24
- 175 Quincy Shore Dr Unit B23
- 144 Kemper St
- 70 Walnut St
- 133 Commander Shea Blvd Unit 502
- 133 Commander Shea Blvd Unit 203
- 133 Commander Shea Blvd Unit 709
Your Personal Tour Guide
Ask me questions while you tour the home.