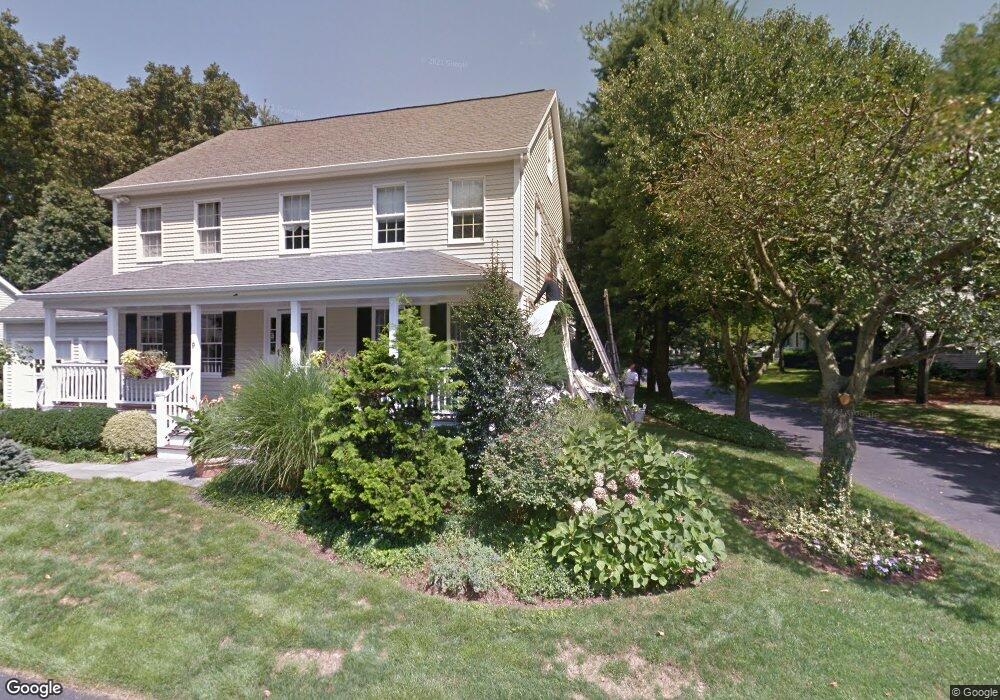
13 Getner Trail Norwalk, CT 06854
Brookside NeighborhoodEstimated Value: $1,136,000 - $1,291,000
5
Beds
3
Baths
2,408
Sq Ft
$495/Sq Ft
Est. Value
About This Home
This home is located at 13 Getner Trail, Norwalk, CT 06854 and is currently estimated at $1,193,140, approximately $495 per square foot. 13 Getner Trail is a home located in Fairfield County with nearby schools including Brookside Elementary School, Roton Middle School, and Brien Mcmahon High School.
Ownership History
Date
Name
Owned For
Owner Type
Purchase Details
Closed on
Jun 3, 2015
Sold by
Wadr Kimberly
Bought by
Barnett Charles and Barnett Judith
Current Estimated Value
Home Financials for this Owner
Home Financials are based on the most recent Mortgage that was taken out on this home.
Original Mortgage
$670,000
Outstanding Balance
$516,514
Interest Rate
3.62%
Estimated Equity
$676,626
Purchase Details
Closed on
Feb 4, 2013
Sold by
Ward Stevenson
Bought by
Burt Kimberly
Purchase Details
Closed on
Jan 22, 2010
Sold by
Ward Kimberly A and Ward Stevenson E
Bought by
Ward Kimberly A
Purchase Details
Closed on
Oct 3, 2007
Sold by
Micciche Frank V and Micciche Daryl A
Bought by
Ward Kimberly A and Ward Stevenson E
Purchase Details
Closed on
May 30, 2003
Sold by
Keegan Paul W and Keegan Kathleen
Bought by
Micciche Daryl A and Micciche Frank
Purchase Details
Closed on
Oct 10, 1996
Sold by
Getner Farms Assoc Inc
Bought by
Keegan Paul W and Keegan Kathleen
Create a Home Valuation Report for This Property
The Home Valuation Report is an in-depth analysis detailing your home's value as well as a comparison with similar homes in the area
Home Values in the Area
Average Home Value in this Area
Purchase History
| Date | Buyer | Sale Price | Title Company |
|---|---|---|---|
| Barnett Charles | $840,000 | -- | |
| Barnett Charles | $840,000 | -- | |
| Burt Kimberly | -- | -- | |
| Burt Kimberly | -- | -- | |
| Ward Kimberly A | -- | -- | |
| Ward Kimberly A | -- | -- | |
| Ward Kimberly A | $770,000 | -- | |
| Ward Kimberly A | $770,000 | -- | |
| Micciche Daryl A | $640,000 | -- | |
| Micciche Daryl A | $640,000 | -- | |
| Keegan Paul W | $354,000 | -- | |
| Keegan Paul W | $354,000 | -- |
Source: Public Records
Mortgage History
| Date | Status | Borrower | Loan Amount |
|---|---|---|---|
| Open | Keegan Paul W | $670,000 | |
| Closed | Keegan Paul W | $670,000 |
Source: Public Records
Tax History
| Year | Tax Paid | Tax Assessment Tax Assessment Total Assessment is a certain percentage of the fair market value that is determined by local assessors to be the total taxable value of land and additions on the property. | Land | Improvement |
|---|---|---|---|---|
| 2025 | $15,069 | $634,740 | $143,860 | $490,880 |
| 2024 | $14,837 | $634,740 | $143,860 | $490,880 |
| 2023 | $12,783 | $512,020 | $131,880 | $380,140 |
| 2022 | $12,582 | $512,020 | $131,880 | $380,140 |
| 2021 | $10,706 | $512,020 | $131,880 | $380,140 |
| 2020 | $12,087 | $512,020 | $131,880 | $380,140 |
| 2019 | $11,934 | $512,020 | $131,880 | $380,140 |
| 2018 | $11,409 | $440,000 | $136,920 | $303,080 |
| 2017 | $11,011 | $440,000 | $136,920 | $303,080 |
| 2016 | $11,280 | $443,410 | $136,920 | $306,490 |
| 2015 | $10,054 | $440,000 | $136,920 | $303,080 |
| 2014 | -- | $440,000 | $136,920 | $303,080 |
Source: Public Records
Map
Nearby Homes
- 5 Topping Ln
- 18 Oakhill Ave
- 105 Richards Ave Unit 1407
- 2 Rochelle Rd
- 97 Richards Ave Unit B10
- 171 Raymond St
- 29 Richmond Dr
- 8 Michael St
- 24 Scribner Ave
- 2 Red Rose Cir
- 12 Dellwood Rd
- 6 Acorn Ln
- 18 Auburn St
- 9 Point o Woods Rd S
- 4 Senga Rd
- 9 Knollwood Rd
- 5 Mcallister Ave
- 12 Arbor Ct
- 40 Arnold Ln
- 176 Bouton St
- 6 Getner Trail
- 6 Getner Trail Unit 6
- 14 Getner Trail
- 8 Getner Trail
- 7 Getner Trail
- 7 Getner Trail Unit 7
- 15 Getner Trail
- 3 Getner Trail
- 12 Getner Trail
- 9 Getner Trail
- 4 Getner Trail
- 5 Getner Trail
- 16 Getner Trail
- 10 Getner Trail
- 2 Getner Trail
- 11 Getner Trail
- 1 Getner Trail
- 17 Getner Trail
- 2 Highmeadow
- 2 Highmeadow Unit 2
Your Personal Tour Guide
Ask me questions while you tour the home.