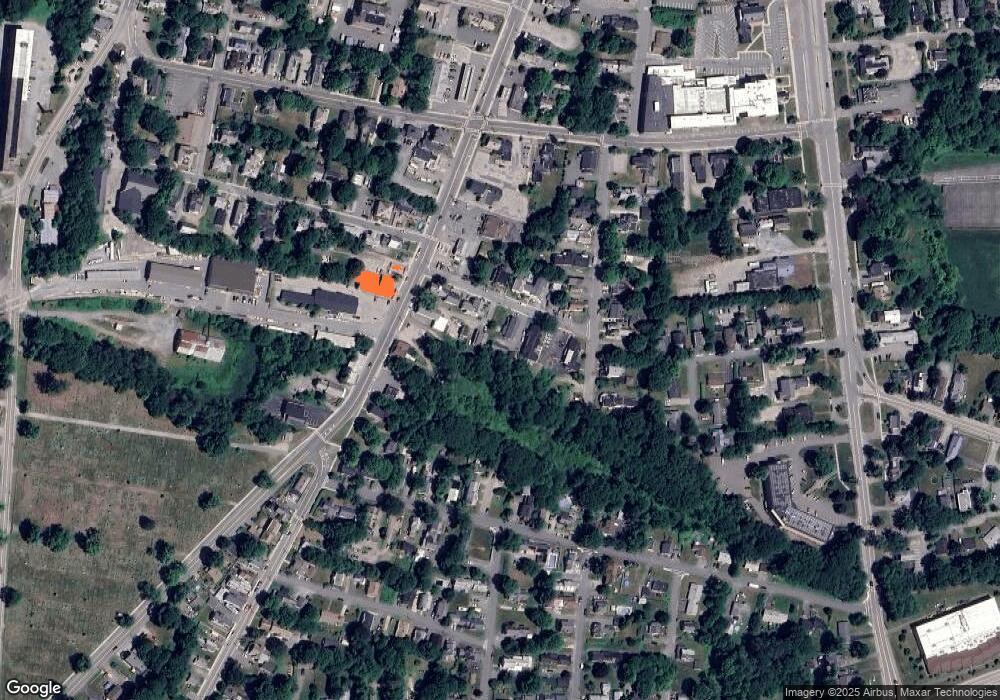
13 Green St Claremont, NH 03743
South End NeighborhoodEstimated Value: $224,000 - $586,000
6
Beds
6
Baths
4,742
Sq Ft
$100/Sq Ft
Est. Value
About This Home
This home is located at 13 Green St, Claremont, NH 03743 and is currently estimated at $472,844, approximately $99 per square foot. 13 Green St is a home located in Sullivan County with nearby schools including Maple Avenue School, Claremont Middle School, and Stevens High School.
Ownership History
Date
Name
Owned For
Owner Type
Purchase Details
Closed on
Sep 8, 2017
Sold by
Beaudry Reginald V
Bought by
Young Jeffrey S
Current Estimated Value
Home Financials for this Owner
Home Financials are based on the most recent Mortgage that was taken out on this home.
Original Mortgage
$48,800
Outstanding Balance
$40,773
Interest Rate
3.92%
Estimated Equity
$432,071
Purchase Details
Closed on
Mar 16, 2001
Sold by
Daley Brian F and Daley Martha J
Bought by
Beaudry Reginald V
Home Financials for this Owner
Home Financials are based on the most recent Mortgage that was taken out on this home.
Original Mortgage
$37,800
Interest Rate
7.01%
Create a Home Valuation Report for This Property
The Home Valuation Report is an in-depth analysis detailing your home's value as well as a comparison with similar homes in the area
Home Values in the Area
Average Home Value in this Area
Purchase History
| Date | Buyer | Sale Price | Title Company |
|---|---|---|---|
| Young Jeffrey S | $72,000 | -- | |
| Beaudry Reginald V | $42,000 | -- |
Source: Public Records
Mortgage History
| Date | Status | Borrower | Loan Amount |
|---|---|---|---|
| Open | Young Jeffrey S | $48,800 | |
| Previous Owner | Beaudry Reginald V | $37,800 |
Source: Public Records
Tax History Compared to Growth
Tax History
| Year | Tax Paid | Tax Assessment Tax Assessment Total Assessment is a certain percentage of the fair market value that is determined by local assessors to be the total taxable value of land and additions on the property. | Land | Improvement |
|---|---|---|---|---|
| 2024 | $3,877 | $132,500 | $25,200 | $107,300 |
| 2023 | $3,684 | $132,500 | $25,200 | $107,300 |
| 2022 | $2,805 | $67,300 | $11,600 | $55,700 |
| 2021 | $2,758 | $67,300 | $11,600 | $55,700 |
| 2020 | $2,740 | $67,300 | $11,600 | $55,700 |
| 2019 | $2,709 | $67,300 | $11,600 | $55,700 |
| 2018 | $2,718 | $64,600 | $11,600 | $53,000 |
| 2017 | $2,756 | $64,600 | $11,600 | $53,000 |
| 2016 | $2,753 | $64,600 | $11,600 | $53,000 |
| 2015 | $2,679 | $64,600 | $11,600 | $53,000 |
| 2014 | $2,670 | $64,600 | $11,600 | $53,000 |
| 2013 | $3,281 | $90,500 | $12,000 | $78,500 |
Source: Public Records
Map
Nearby Homes