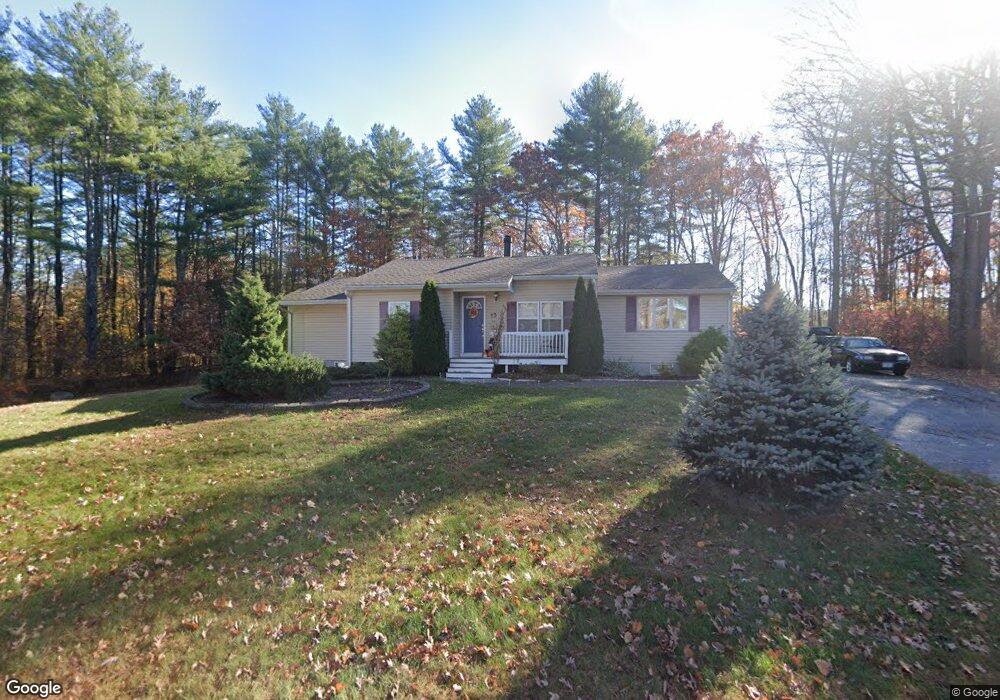
13 Hall Rd Londonderry, NH 03053
Estimated Value: $508,000 - $693,000
3
Beds
2
Baths
1,522
Sq Ft
$375/Sq Ft
Est. Value
About This Home
This home is located at 13 Hall Rd, Londonderry, NH 03053 and is currently estimated at $570,845, approximately $375 per square foot. 13 Hall Rd is a home located in Rockingham County with nearby schools including North Londonderry Elementary School, Londonderry Middle School, and Londonderry Senior High School.
Ownership History
Date
Name
Owned For
Owner Type
Purchase Details
Closed on
Apr 26, 2010
Sold by
Bureau Brian J
Bought by
Finley Bryan D
Current Estimated Value
Home Financials for this Owner
Home Financials are based on the most recent Mortgage that was taken out on this home.
Original Mortgage
$265,487
Outstanding Balance
$177,509
Interest Rate
5%
Estimated Equity
$393,336
Purchase Details
Closed on
Feb 20, 2007
Sold by
Johnson Charles W and Johnson Partridge-Johnson L
Bought by
Martin Timothy R
Purchase Details
Closed on
Aug 18, 1999
Sold by
Killam Jonathan B and Killam Susan W
Bought by
Johnson Loretta A P and Johnson Charles W
Create a Home Valuation Report for This Property
The Home Valuation Report is an in-depth analysis detailing your home's value as well as a comparison with similar homes in the area
Home Values in the Area
Average Home Value in this Area
Purchase History
| Date | Buyer | Sale Price | Title Company |
|---|---|---|---|
| Finley Bryan D | $259,900 | -- | |
| Finley Bryan D | $259,900 | -- | |
| Martin Timothy R | $218,000 | -- | |
| Martin Timothy R | $218,000 | -- | |
| Johnson Loretta A P | $130,000 | -- | |
| Johnson Loretta A P | $130,000 | -- |
Source: Public Records
Mortgage History
| Date | Status | Borrower | Loan Amount |
|---|---|---|---|
| Open | Johnson Loretta A P | $265,487 | |
| Closed | Johnson Loretta A P | $265,487 | |
| Previous Owner | Johnson Loretta A P | $50,000 |
Source: Public Records
Tax History Compared to Growth
Tax History
| Year | Tax Paid | Tax Assessment Tax Assessment Total Assessment is a certain percentage of the fair market value that is determined by local assessors to be the total taxable value of land and additions on the property. | Land | Improvement |
|---|---|---|---|---|
| 2024 | $6,479 | $401,400 | $179,900 | $221,500 |
| 2023 | $6,282 | $401,400 | $179,900 | $221,500 |
| 2022 | $5,808 | $314,300 | $134,900 | $179,400 |
| 2021 | $5,657 | $307,800 | $134,900 | $172,900 |
| 2020 | $5,705 | $283,700 | $112,400 | $171,300 |
| 2019 | $5,501 | $283,700 | $112,400 | $171,300 |
| 2018 | $5,023 | $230,400 | $93,700 | $136,700 |
| 2017 | $4,979 | $230,400 | $93,700 | $136,700 |
| 2016 | $4,954 | $230,400 | $93,700 | $136,700 |
| 2015 | $4,843 | $230,400 | $93,700 | $136,700 |
| 2014 | $4,859 | $230,400 | $93,700 | $136,700 |
| 2011 | -- | $232,700 | $93,700 | $139,000 |
Source: Public Records
Map
Nearby Homes
- 28 Barksdale Ave
- 8 Barksdale Ave
- 27 Buckingham Dr
- 15 Harvey Rd
- 5 Webster Rd
- 17 Welch Rd
- 4 Crestview Cir Unit 119
- 32 Noyes Rd
- 38 Bartley Hill Rd
- 36 Perkins Rd
- 50 Bartley Hill Rd
- 10100 S Willow St Unit 214
- 10100 S Willow St Unit 101
- 10100 S Willow St Unit 109
- 10100 S Willow St Unit 207
- 10100 S Willow St Unit 110
- 10100 S Willow St Unit 204
- 1035 S Mammoth Rd Unit 6
- 10 Auburn Rd
- 19 Auburn Rd