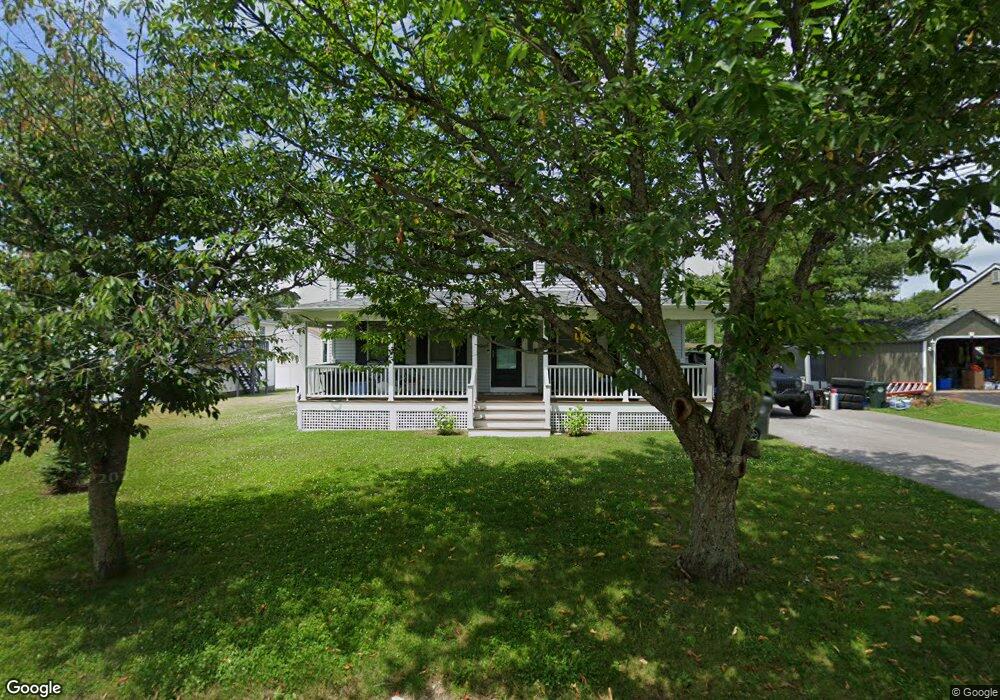
13 Hamlet Ct Bristol, RI 02809
Bristol Highlands NeighborhoodEstimated Value: $622,000 - $903,000
3
Beds
3
Baths
2,870
Sq Ft
$266/Sq Ft
Est. Value
About This Home
This home is located at 13 Hamlet Ct, Bristol, RI 02809 and is currently estimated at $763,116, approximately $265 per square foot. 13 Hamlet Ct is a home located in Bristol County with nearby schools including Mt. Hope High School, Highlander Charter Middle and High School, and Our Lady of Mt. Carmel School.
Ownership History
Date
Name
Owned For
Owner Type
Purchase Details
Closed on
Jul 1, 2010
Sold by
Durfee Matthew A
Bought by
Friese Jason and Friese Jennie
Current Estimated Value
Home Financials for this Owner
Home Financials are based on the most recent Mortgage that was taken out on this home.
Original Mortgage
$341,259
Interest Rate
4.88%
Mortgage Type
Purchase Money Mortgage
Purchase Details
Closed on
Jul 29, 2005
Sold by
Andrade Kristen
Bought by
Durfee Matthew A and Dacosta Jessica
Purchase Details
Closed on
Feb 27, 2003
Sold by
Andrade Michael and Andrade Felicia
Bought by
Andrade Michael and Andrade Kristen
Purchase Details
Closed on
Sep 29, 2000
Sold by
Caromile Construction
Bought by
Andrade Michael A and Narcise Felicia
Purchase Details
Closed on
Apr 13, 2000
Sold by
57 Associates
Bought by
Caromile Const Inc
Create a Home Valuation Report for This Property
The Home Valuation Report is an in-depth analysis detailing your home's value as well as a comparison with similar homes in the area
Home Values in the Area
Average Home Value in this Area
Purchase History
| Date | Buyer | Sale Price | Title Company |
|---|---|---|---|
| Friese Jason | $346,000 | -- | |
| Durfee Matthew A | $371,000 | -- | |
| Andrade Michael | $290,000 | -- | |
| Andrade Michael A | $68,000 | -- | |
| Caromile Const Inc | $58,000 | -- |
Source: Public Records
Mortgage History
| Date | Status | Borrower | Loan Amount |
|---|---|---|---|
| Open | Caromile Const Inc | $326,501 | |
| Closed | Caromile Const Inc | $341,259 | |
| Previous Owner | Caromile Const Inc | $287,000 |
Source: Public Records
Tax History
| Year | Tax Paid | Tax Assessment Tax Assessment Total Assessment is a certain percentage of the fair market value that is determined by local assessors to be the total taxable value of land and additions on the property. | Land | Improvement |
|---|---|---|---|---|
| 2025 | $6,005 | $434,500 | $153,100 | $281,400 |
| 2024 | $6,005 | $434,500 | $153,100 | $281,400 |
| 2023 | $5,805 | $434,500 | $153,100 | $281,400 |
| 2022 | $5,649 | $434,500 | $153,100 | $281,400 |
| 2021 | $5,256 | $365,500 | $128,200 | $237,300 |
| 2020 | $5,143 | $365,500 | $128,200 | $237,300 |
| 2019 | $5,015 | $365,500 | $128,200 | $237,300 |
| 2018 | $5,340 | $347,200 | $126,100 | $221,100 |
| 2017 | $4,789 | $321,000 | $118,700 | $202,300 |
| 2016 | $4,741 | $321,000 | $118,700 | $202,300 |
| 2015 | $4,504 | $321,000 | $118,700 | $202,300 |
| 2014 | $4,101 | $314,040 | $120,200 | $193,840 |
Source: Public Records
Map
Nearby Homes
- 3 Knowlton Ct
- 7 Knowlton Ct
- 5 Knowlton Ct
- 1 Knowlton Ct
- 1220 Hope St
- 1 Hydraulion Ave
- 669 Metacom Ave Unit 25
- 667 Metacom Ave Unit 14
- 556 Metacom Ave
- 62 Beachmount Ave
- 29 Forest Rd
- 30 Sowams Dr
- 0 Surf Dr
- 1382 Hope St
- 461 North Ln
- 417 North Ln
- 5 Saint Theresa Ave
- 3 Betsy Dr
- 85 Bay View Ave Unit 2
- 2 Bagy Wrinkle Cove
Your Personal Tour Guide
Ask me questions while you tour the home.