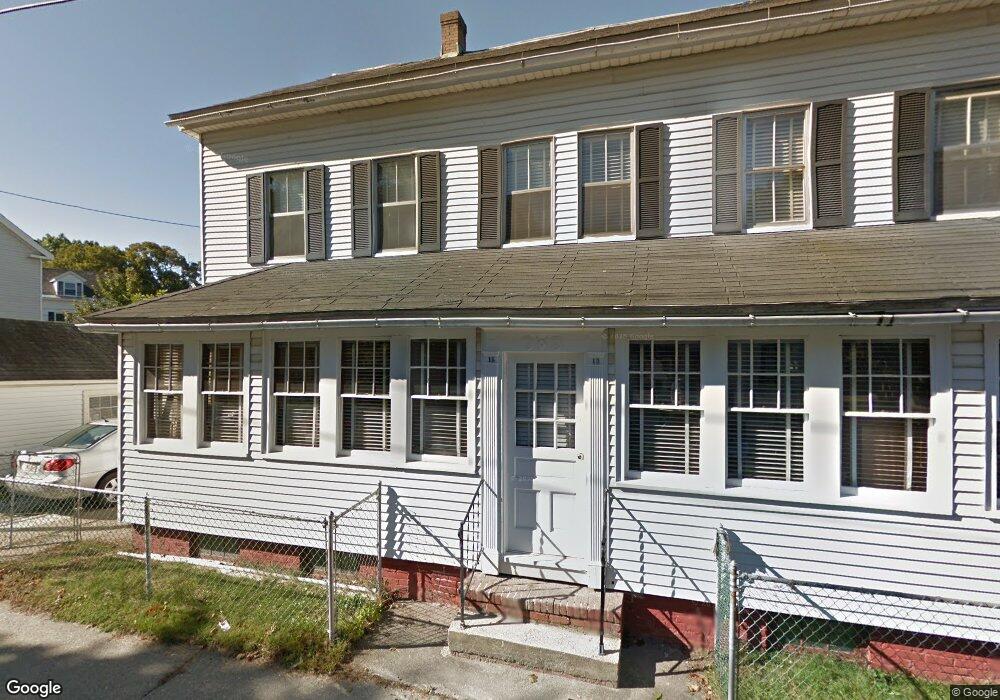
13 Harrison Ave Easthampton, MA 01027
Estimated Value: $377,000 - $489,000
6
Beds
4
Baths
2,214
Sq Ft
$198/Sq Ft
Est. Value
About This Home
This home is located at 13 Harrison Ave, Easthampton, MA 01027 and is currently estimated at $439,306, approximately $198 per square foot. 13 Harrison Ave is a home located in Hampshire County with nearby schools including Easthampton High School, Hilltown Cooperative Charter Public School, and Tri-County Schools.
Ownership History
Date
Name
Owned For
Owner Type
Purchase Details
Closed on
Dec 3, 2024
Sold by
Beaudry Craig N
Bought by
Bruscoe Stephen F
Current Estimated Value
Home Financials for this Owner
Home Financials are based on the most recent Mortgage that was taken out on this home.
Original Mortgage
$400,895
Outstanding Balance
$397,523
Interest Rate
6.44%
Mortgage Type
FHA
Estimated Equity
$41,783
Purchase Details
Closed on
Jul 8, 2020
Sold by
Wilk Stanislawa
Bought by
Beaudry Craig N
Home Financials for this Owner
Home Financials are based on the most recent Mortgage that was taken out on this home.
Original Mortgage
$269,800
Interest Rate
3.1%
Mortgage Type
New Conventional
Purchase Details
Closed on
Mar 31, 2006
Sold by
Wieckows Wojciech Leopol
Bought by
Wilk Stanislawa
Purchase Details
Closed on
May 10, 1993
Sold by
Geryk Beulah P
Bought by
Wieckowski Leopold W
Create a Home Valuation Report for This Property
The Home Valuation Report is an in-depth analysis detailing your home's value as well as a comparison with similar homes in the area
Home Values in the Area
Average Home Value in this Area
Purchase History
| Date | Buyer | Sale Price | Title Company |
|---|---|---|---|
| Bruscoe Stephen F | $430,000 | None Available | |
| Bruscoe Stephen F | $430,000 | None Available | |
| Bruscoe Stephen F | $430,000 | None Available | |
| Beaudry Craig N | $284,000 | None Available | |
| Beaudry Craig N | $284,000 | None Available | |
| Beaudry Craig N | $284,000 | None Available | |
| Wilk Stanislawa | $200,000 | -- | |
| Wilk Stanislawa | $200,000 | -- | |
| Wieckowski Leopold W | $69,000 | -- | |
| Wieckowski Leopold W | $69,000 | -- |
Source: Public Records
Mortgage History
| Date | Status | Borrower | Loan Amount |
|---|---|---|---|
| Open | Bruscoe Stephen F | $400,895 | |
| Closed | Bruscoe Stephen F | $400,895 | |
| Previous Owner | Beaudry Craig N | $269,800 |
Source: Public Records
Tax History
| Year | Tax Paid | Tax Assessment Tax Assessment Total Assessment is a certain percentage of the fair market value that is determined by local assessors to be the total taxable value of land and additions on the property. | Land | Improvement |
|---|---|---|---|---|
| 2025 | $5,139 | $375,900 | $83,700 | $292,200 |
| 2024 | $4,951 | $365,100 | $81,300 | $283,800 |
| 2023 | $3,689 | $251,800 | $64,100 | $187,700 |
| 2022 | $4,162 | $251,800 | $64,100 | $187,700 |
| 2021 | $4,380 | $249,700 | $64,100 | $185,600 |
| 2020 | $4,472 | $251,800 | $64,100 | $187,700 |
| 2019 | $3,247 | $210,000 | $64,100 | $145,900 |
| 2018 | $3,170 | $198,100 | $60,500 | $137,600 |
| 2017 | $3,106 | $191,600 | $58,200 | $133,400 |
| 2016 | $3,085 | $197,900 | $58,200 | $139,700 |
| 2015 | -- | $197,900 | $58,200 | $139,700 |
Source: Public Records
Map
Nearby Homes
- 12 Glen Cove Place Unit B
- 10 Glen Cove Place Unit A
- 18-20 Oakdale Place
- 29 Parsons St Unit 1
- 33 Knipfer Ave
- 2 Oak St
- 40 Clark St
- 7 Union Ct
- 19 Nicols Way Unit 19
- 4 Gaugh St
- 11 Dragon Cir
- 26 Winter St
- 6 Wilton Rd
- M143 &152 Glendale St
- 385 Main St
- 41 South St Unit 11
- 336 Main St
- 131 West St Unit 131
- 296 Old Wilson Rd
- 6 S St & Abutting Lots
- 13 Harrison Ave Unit 15
- 14 Harrison Ave Unit 16
- 17 Harrison Ave Unit 19
- 9 Harrison Ave Unit 11
- 50-52 Emerald Place
- 50 Emerald Place Unit 52
- 18 Harrison Ave Unit 20
- 46 Emerald Place Unit 48
- 10 Harrison Ave Unit 12
- 13 Lincoln St
- 13 Lincoln St Unit 15
- 13 Lincoln St
- 53 Emerald Place Unit 55
- 17 Lincoln St Unit 19
- 42 Emerald Place Unit 44
- 49 Emerald Place Unit 51
- 57 Harrison Ave
- 9 Lincoln St Unit 11
- 11 Lincoln St Unit 11
- 68 Harrison Ave
Your Personal Tour Guide
Ask me questions while you tour the home.