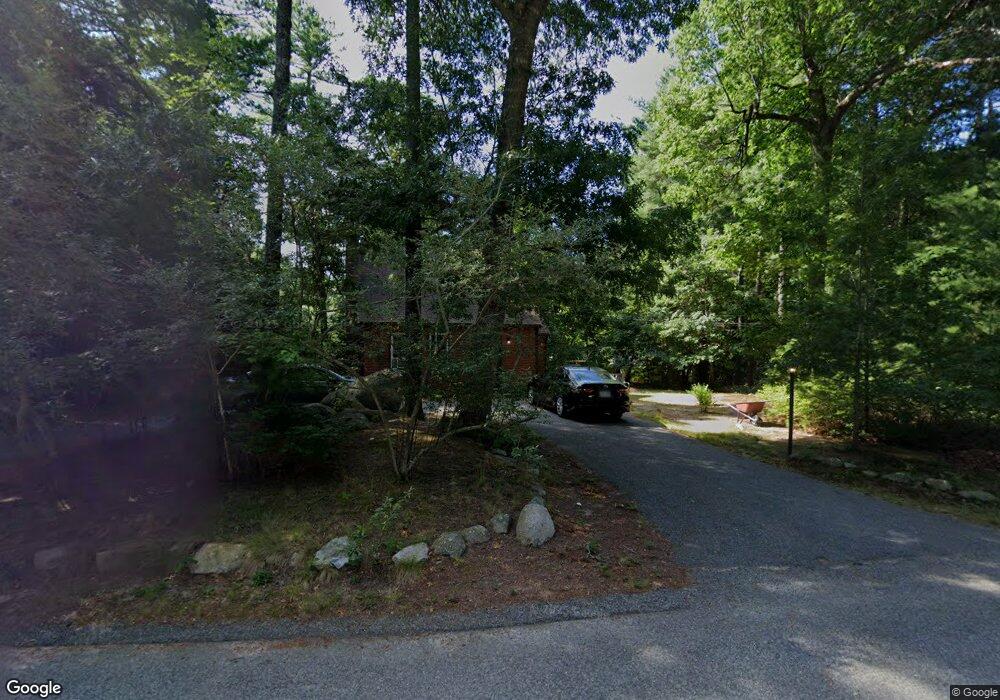
13 Helen St West Wareham, MA 02576
Estimated Value: $348,000 - $441,000
2
Beds
1
Bath
936
Sq Ft
$423/Sq Ft
Est. Value
About This Home
This home is located at 13 Helen St, West Wareham, MA 02576 and is currently estimated at $395,508, approximately $422 per square foot. 13 Helen St is a home located in Plymouth County.
Ownership History
Date
Name
Owned For
Owner Type
Purchase Details
Closed on
Jul 20, 2006
Sold by
Hinxman Eric E and Hinxman Cathleen
Bought by
Hinxman Eric E and Hinxman Cathleen
Current Estimated Value
Home Financials for this Owner
Home Financials are based on the most recent Mortgage that was taken out on this home.
Original Mortgage
$120,000
Outstanding Balance
$70,944
Interest Rate
6.67%
Mortgage Type
Purchase Money Mortgage
Estimated Equity
$324,564
Create a Home Valuation Report for This Property
The Home Valuation Report is an in-depth analysis detailing your home's value as well as a comparison with similar homes in the area
Home Values in the Area
Average Home Value in this Area
Purchase History
| Date | Buyer | Sale Price | Title Company |
|---|---|---|---|
| Hinxman Eric E | -- | -- | |
| Hinxman Eric E | -- | -- |
Source: Public Records
Mortgage History
| Date | Status | Borrower | Loan Amount |
|---|---|---|---|
| Open | Hinxman Eric E | $120,000 | |
| Closed | Hinxman Eric E | $120,000 |
Source: Public Records
Tax History Compared to Growth
Tax History
| Year | Tax Paid | Tax Assessment Tax Assessment Total Assessment is a certain percentage of the fair market value that is determined by local assessors to be the total taxable value of land and additions on the property. | Land | Improvement |
|---|---|---|---|---|
| 2025 | $3,369 | $323,300 | $111,700 | $211,600 |
| 2024 | $3,491 | $310,900 | $87,800 | $223,100 |
| 2023 | $3,087 | $275,800 | $79,800 | $196,000 |
| 2022 | $3,087 | $234,200 | $79,800 | $154,400 |
| 2021 | $3,050 | $226,800 | $79,800 | $147,000 |
| 2020 | $2,911 | $219,500 | $79,800 | $139,700 |
| 2019 | $2,892 | $217,600 | $78,900 | $138,700 |
| 2018 | $2,635 | $193,300 | $78,900 | $114,400 |
| 2017 | $2,534 | $188,400 | $78,900 | $109,500 |
| 2016 | $2,448 | $180,900 | $78,700 | $102,200 |
| 2015 | $2,364 | $180,900 | $78,700 | $102,200 |
| 2014 | $2,286 | $177,900 | $74,700 | $103,200 |
Source: Public Records
Map
Nearby Homes