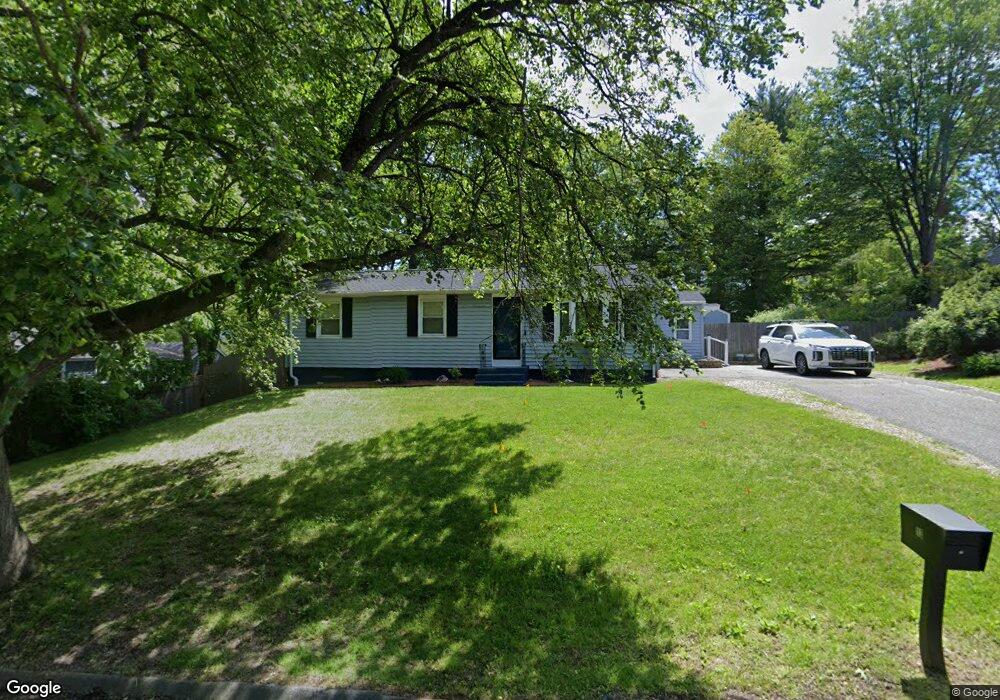
13 Hillside Dr Springfield, MA 01118
Sixteen Acres NeighborhoodEstimated Value: $340,401 - $380,000
3
Beds
2
Baths
1,704
Sq Ft
$212/Sq Ft
Est. Value
About This Home
This home is located at 13 Hillside Dr, Springfield, MA 01118 and is currently estimated at $361,600, approximately $212 per square foot. 13 Hillside Dr is a home located in Hampden County with nearby schools including Arthur T Talmadge Elementary School, M Marcus Kiley Middle, and Springfield High School of Science and Technology.
Ownership History
Date
Name
Owned For
Owner Type
Purchase Details
Closed on
Sep 15, 1999
Sold by
Burelle Richard F and Burelle Sylvia I
Bought by
Martin Larry and Martin Alexandrine
Current Estimated Value
Home Financials for this Owner
Home Financials are based on the most recent Mortgage that was taken out on this home.
Original Mortgage
$98,949
Outstanding Balance
$29,357
Interest Rate
7.83%
Mortgage Type
Purchase Money Mortgage
Estimated Equity
$332,243
Create a Home Valuation Report for This Property
The Home Valuation Report is an in-depth analysis detailing your home's value as well as a comparison with similar homes in the area
Home Values in the Area
Average Home Value in this Area
Purchase History
| Date | Buyer | Sale Price | Title Company |
|---|---|---|---|
| Martin Larry | $99,000 | -- |
Source: Public Records
Mortgage History
| Date | Status | Borrower | Loan Amount |
|---|---|---|---|
| Open | Martin Larry | $98,949 | |
| Previous Owner | Martin Larry | $85,000 | |
| Previous Owner | Martin Larry | $25,000 | |
| Previous Owner | Martin Larry | $60,000 |
Source: Public Records
Tax History
| Year | Tax Paid | Tax Assessment Tax Assessment Total Assessment is a certain percentage of the fair market value that is determined by local assessors to be the total taxable value of land and additions on the property. | Land | Improvement |
|---|---|---|---|---|
| 2025 | $5,145 | $328,100 | $59,400 | $268,700 |
| 2024 | $4,837 | $301,200 | $59,400 | $241,800 |
| 2023 | $3,913 | $229,500 | $56,500 | $173,000 |
| 2022 | $4,009 | $213,000 | $56,500 | $156,500 |
| 2021 | $3,869 | $204,700 | $51,400 | $153,300 |
| 2020 | $3,734 | $191,200 | $51,400 | $139,800 |
| 2019 | $3,605 | $183,200 | $51,400 | $131,800 |
| 2018 | $3,590 | $182,400 | $51,400 | $131,000 |
| 2017 | $3,358 | $170,800 | $51,400 | $119,400 |
| 2016 | $3,269 | $166,300 | $51,400 | $114,900 |
| 2015 | $3,267 | $166,100 | $51,400 | $114,700 |
Source: Public Records
Map
Nearby Homes
- 41 Hillside Dr
- 24 Wands St
- 85 Talmadge Dr
- 86 Talmadge Dr
- 25 Laurelwood Ln
- 81 W Crystal Brook Dr
- 17 Pebble Mill Rd
- 86 Wildwood Ave
- 120 Bridle Path Rd
- 49 Corcoran Blvd
- 55 Allen St
- 206 Treetop Ave
- 1962 Allen St
- 125 Manor Ct Unit 125
- 19 Manor Ct Unit 19
- 101 Regal St
- 647 Plumtree Rd
- 17 Skyridge Ln
- 46 Hadley St
- 65 Helen Cir
Your Personal Tour Guide
Ask me questions while you tour the home.