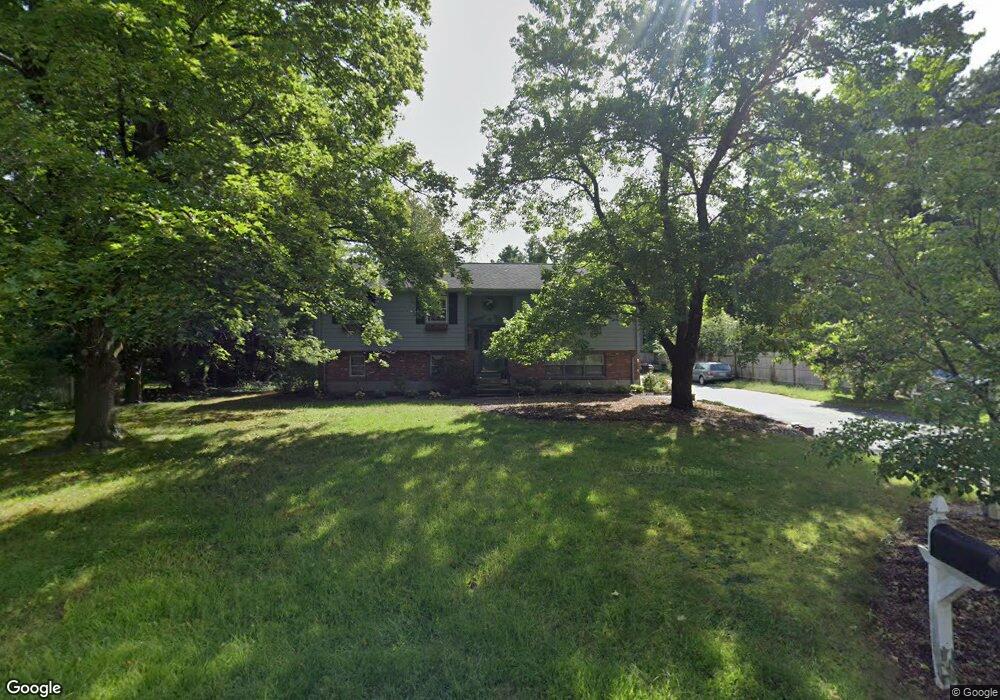
13 Howard St Holliston, MA 01746
Estimated Value: $656,000 - $779,000
3
Beds
3
Baths
1,434
Sq Ft
$501/Sq Ft
Est. Value
About This Home
This home is located at 13 Howard St, Holliston, MA 01746 and is currently estimated at $718,790, approximately $501 per square foot. 13 Howard St is a home located in Middlesex County with nearby schools including Placentino Elementary School, Miller Elementary School, and Robert H. Adams Middle School.
Ownership History
Date
Name
Owned For
Owner Type
Purchase Details
Closed on
Mar 25, 2015
Sold by
Stackpole Leonard S and Stackpole Karen W
Bought by
Stackpole Ft and Stackpole Leonard S
Current Estimated Value
Purchase Details
Closed on
Jun 14, 1979
Bought by
Stackpole Leonard S and Stackpole Karen W
Create a Home Valuation Report for This Property
The Home Valuation Report is an in-depth analysis detailing your home's value as well as a comparison with similar homes in the area
Home Values in the Area
Average Home Value in this Area
Purchase History
| Date | Buyer | Sale Price | Title Company |
|---|---|---|---|
| Stackpole Ft | -- | -- | |
| Stackpole Leonard S | $63,000 | -- |
Source: Public Records
Mortgage History
| Date | Status | Borrower | Loan Amount |
|---|---|---|---|
| Previous Owner | Stackpole Leonard S | $63,000 | |
| Previous Owner | Stackpole Leonard S | $27,000 | |
| Previous Owner | Stackpole Leonard S | $80,000 |
Source: Public Records
Tax History
| Year | Tax Paid | Tax Assessment Tax Assessment Total Assessment is a certain percentage of the fair market value that is determined by local assessors to be the total taxable value of land and additions on the property. | Land | Improvement |
|---|---|---|---|---|
| 2025 | $11,053 | $754,500 | $282,200 | $472,300 |
| 2024 | $10,087 | $669,800 | $282,200 | $387,600 |
| 2023 | $9,734 | $632,100 | $282,200 | $349,900 |
| 2022 | $9,243 | $531,800 | $282,200 | $249,600 |
| 2021 | $9,016 | $505,100 | $258,700 | $246,400 |
| 2020 | $9,301 | $493,400 | $257,300 | $236,100 |
| 2019 | $8,622 | $457,900 | $223,800 | $234,100 |
| 2018 | $8,549 | $457,900 | $223,800 | $234,100 |
| 2017 | $8,173 | $441,300 | $215,300 | $226,000 |
| 2016 | $7,785 | $414,300 | $188,300 | $226,000 |
| 2015 | $7,711 | $397,900 | $167,700 | $230,200 |
Source: Public Records
Map
Nearby Homes
- 35 Peter St
- 48 Hemlock Dr
- 22 Greenview Dr
- 26 Mechanic St
- 1366 Washington St
- 261 Rolling Meadow Dr
- 51 Burnap Rd Unit 3
- 244 Rolling Meadow Dr
- 25 Irving Place
- 66 Lakeshore Dr
- 50 Morgans Way
- 4 Bullard Cir
- 0 Hill St
- 13 Karen Cir
- 3 Thayer Rd
- 731 Norfolk St
- 31 Francine Dr
- 6 Skyview Terrace
- 17 Fairway Ln
- 26 Timber Crest Dr
- 15 Howard St
- 11 Howard St
- 14 Howard St
- 39 Underwood St
- 36 Howard St
- 3 Peter St
- 15 Peter St
- 48 Underwood St
- 40 Underwood St
- 60 Underwood St
- 23 Peter St
- 48 Howard St
- 25 Underwood St
- 66 Howard St
- 22 Underwood St
- 1195 Washington St
- 109 Underwood St
- 1163 Washington St
- 1201 Washington St
- 1147 Washington St
Your Personal Tour Guide
Ask me questions while you tour the home.