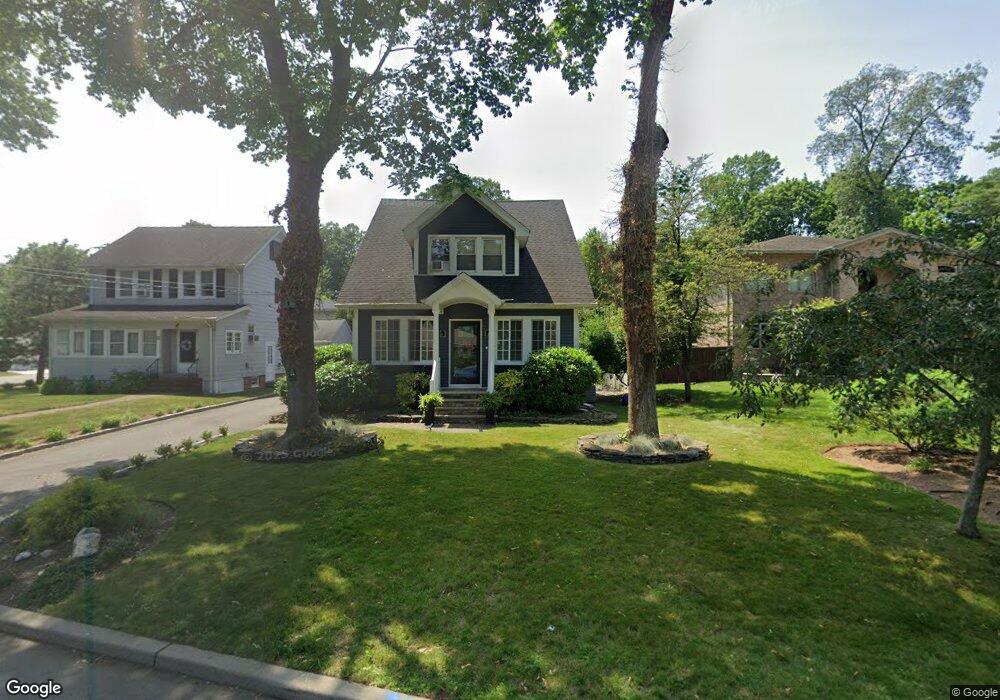
13 Jefferson Ave Cresskill, NJ 07626
Estimated Value: $758,681 - $1,035,000
Studio
--
Bath
1,610
Sq Ft
$533/Sq Ft
Est. Value
About This Home
This home is located at 13 Jefferson Ave, Cresskill, NJ 07626 and is currently estimated at $857,670, approximately $532 per square foot. 13 Jefferson Ave is a home located in Bergen County with nearby schools including Cresskill High School, Lubavitch On The Palisades, and Academy of Our Lady of Mount Carmel.
Ownership History
Date
Name
Owned For
Owner Type
Purchase Details
Closed on
Sep 4, 2007
Sold by
Baruch Dan and Baruch Danielle
Bought by
Santiago Carlos and Santiago Olivia
Current Estimated Value
Home Financials for this Owner
Home Financials are based on the most recent Mortgage that was taken out on this home.
Original Mortgage
$415,000
Outstanding Balance
$265,030
Interest Rate
6.74%
Estimated Equity
$592,640
Purchase Details
Closed on
Nov 13, 2000
Sold by
Ross Brian
Bought by
Baruch Dan and Baruch Danielle
Home Financials for this Owner
Home Financials are based on the most recent Mortgage that was taken out on this home.
Original Mortgage
$200,000
Interest Rate
7.76%
Purchase Details
Closed on
Feb 3, 1998
Sold by
Oelfke Robert J and Oelfke Gayle E
Bought by
Ross Brian and Ross Risa B
Home Financials for this Owner
Home Financials are based on the most recent Mortgage that was taken out on this home.
Original Mortgage
$175,400
Interest Rate
7%
Create a Home Valuation Report for This Property
The Home Valuation Report is an in-depth analysis detailing your home's value as well as a comparison with similar homes in the area
Home Values in the Area
Average Home Value in this Area
Purchase History
| Date | Buyer | Sale Price | Title Company |
|---|---|---|---|
| Santiago Carlos | $485,000 | -- | |
| Baruch Dan | $292,000 | -- | |
| Ross Brian | $185,400 | -- |
Source: Public Records
Mortgage History
| Date | Status | Borrower | Loan Amount |
|---|---|---|---|
| Open | Santiago Carlos | $415,000 | |
| Previous Owner | Baruch Dan | $200,000 | |
| Previous Owner | Ross Brian | $175,400 |
Source: Public Records
Tax History
| Year | Tax Paid | Tax Assessment Tax Assessment Total Assessment is a certain percentage of the fair market value that is determined by local assessors to be the total taxable value of land and additions on the property. | Land | Improvement |
|---|---|---|---|---|
| 2025 | $11,452 | $541,300 | $356,100 | $185,200 |
| 2024 | $11,032 | $497,900 | $319,900 | $178,000 |
| 2023 | $10,483 | $475,300 | $302,400 | $172,900 |
| 2022 | $10,733 | $445,900 | $280,200 | $165,700 |
| 2021 | $10,329 | $433,200 | $272,700 | $160,500 |
| 2020 | $10,253 | $421,600 | $264,200 | $157,400 |
| 2019 | $9,989 | $415,000 | $260,700 | $154,300 |
| 2018 | $6,913 | $410,000 | $257,700 | $152,300 |
| 2017 | $9,473 | $348,000 | $190,800 | $157,200 |
| 2016 | $9,191 | $348,000 | $190,800 | $157,200 |
| 2015 | $8,905 | $339,900 | $190,800 | $149,100 |
| 2014 | $8,436 | $339,900 | $190,800 | $149,100 |
Source: Public Records
Map
Nearby Homes
- 17 Jefferson Ave
- 170 Hickory Ave
- 40 5th St
- 136 Stonegate Trail Unit 37
- 119 Stonegate Trail
- 118 Sunset Ln
- 206 10th St
- 292 Magnolia Ave
- 136 Elm St
- 51 Momar Dr
- 17 Wight Place
- 15 Dunn Place
- 25 Division St Unit 403
- 126 Grant Ave
- 114 Hudson Ave
- 121 Lylewood Dr
- 181 Phelps Ave
- 168 4th St
- 10 Orchard Place
- 368 Knickerbocker Rd
- 11 Jefferson Ave
- 11 Phelps Ave
- 15 Phelps Ave
- 10 Jefferson Ave
- 251 Jefferson Ave
- 131 Davenport Ave
- 131 Davenport Ave Unit 1
- 21 Phelps Ave
- 25 Jefferson Ave
- 18 Jefferson Ave
- 247 Jefferson Ave
- 252 Jefferson Ave
- 27 Jefferson Ave
- 22 Phelps Ave
- 243 Jefferson Ave
- 46 Cedar St
- 248 Jefferson Ave
- 121 Davenport Ave
- 29 Jefferson Ave
- 22 Jefferson Ave
Your Personal Tour Guide
Ask me questions while you tour the home.