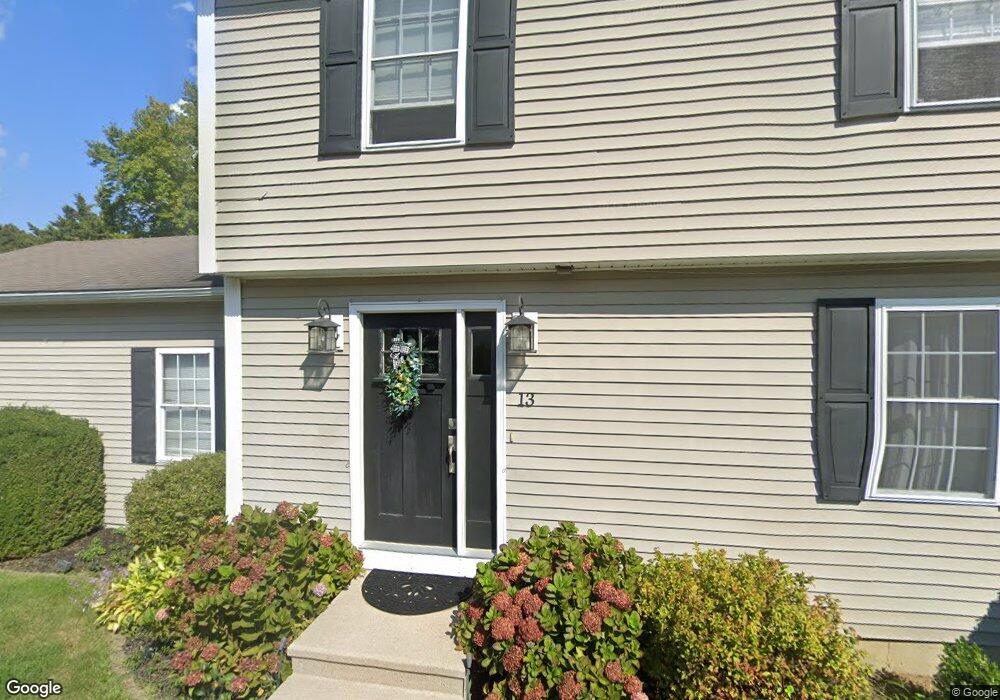
13 Jolly Ln Westerly, RI 02891
Estimated Value: $638,096 - $770,000
3
Beds
3
Baths
1,980
Sq Ft
$356/Sq Ft
Est. Value
About This Home
This home is located at 13 Jolly Ln, Westerly, RI 02891 and is currently estimated at $705,274, approximately $356 per square foot. 13 Jolly Ln is a home located in Washington County with nearby schools including Westerly High School and St. Michael School.
Ownership History
Date
Name
Owned For
Owner Type
Purchase Details
Closed on
Jul 16, 2009
Sold by
Duda Frances A and Meevoy William H
Bought by
Parker Jason A and Parker Jennifer K
Current Estimated Value
Home Financials for this Owner
Home Financials are based on the most recent Mortgage that was taken out on this home.
Original Mortgage
$291,208
Interest Rate
5.31%
Mortgage Type
Purchase Money Mortgage
Purchase Details
Closed on
Nov 24, 1999
Sold by
Shorten Robert H
Bought by
Duda Frances A
Home Financials for this Owner
Home Financials are based on the most recent Mortgage that was taken out on this home.
Original Mortgage
$80,000
Interest Rate
7.77%
Create a Home Valuation Report for This Property
The Home Valuation Report is an in-depth analysis detailing your home's value as well as a comparison with similar homes in the area
Home Values in the Area
Average Home Value in this Area
Purchase History
| Date | Buyer | Sale Price | Title Company |
|---|---|---|---|
| Parker Jason A | $318,000 | -- | |
| Duda Frances A | $157,000 | -- |
Source: Public Records
Mortgage History
| Date | Status | Borrower | Loan Amount |
|---|---|---|---|
| Open | Duda Frances A | $290,206 | |
| Closed | Duda Frances A | $291,208 | |
| Previous Owner | Duda Frances A | $25,000 | |
| Previous Owner | Duda Frances A | $80,000 |
Source: Public Records
Tax History
| Year | Tax Paid | Tax Assessment Tax Assessment Total Assessment is a certain percentage of the fair market value that is determined by local assessors to be the total taxable value of land and additions on the property. | Land | Improvement |
|---|---|---|---|---|
| 2025 | $4,113 | $528,700 | $181,200 | $347,500 |
| 2024 | $3,949 | $377,900 | $129,500 | $248,400 |
| 2023 | $3,839 | $377,900 | $129,500 | $248,400 |
| 2022 | $3,817 | $377,900 | $129,500 | $248,400 |
| 2021 | $3,858 | $319,900 | $112,600 | $207,300 |
| 2020 | $3,791 | $319,900 | $112,600 | $207,300 |
| 2019 | $3,756 | $319,900 | $112,600 | $207,300 |
| 2018 | $3,540 | $286,600 | $112,600 | $174,000 |
| 2017 | $3,439 | $286,600 | $112,600 | $174,000 |
| 2016 | $3,439 | $286,600 | $112,600 | $174,000 |
| 2015 | $3,439 | $306,200 | $120,200 | $186,000 |
| 2014 | $3,335 | $306,200 | $120,200 | $186,000 |
Source: Public Records
Map
Nearby Homes
- 33 Whipple Ave
- 11 Hubbard St
- 24 Abbey Ln Unit 13
- 23 Abbey Ln Unit 12
- 9 Crestview Dr Unit C
- 1 Jovere Dr
- 18 Timothy Dr
- 24 George St
- 60 Margin St Unit 102
- 25 School St Unit 2
- 12 Apache Dr Unit A
- 14 Summertime Cir
- 65 Mechanic St
- 22 Summertime Cir
- 23 Summertime Cir
- 2 Pawcatuck Ave
- 39 Summertime Cir
- 38 Summertime Cir
- 45 Summertime Cir
- 22 Colonial Dr
Your Personal Tour Guide
Ask me questions while you tour the home.