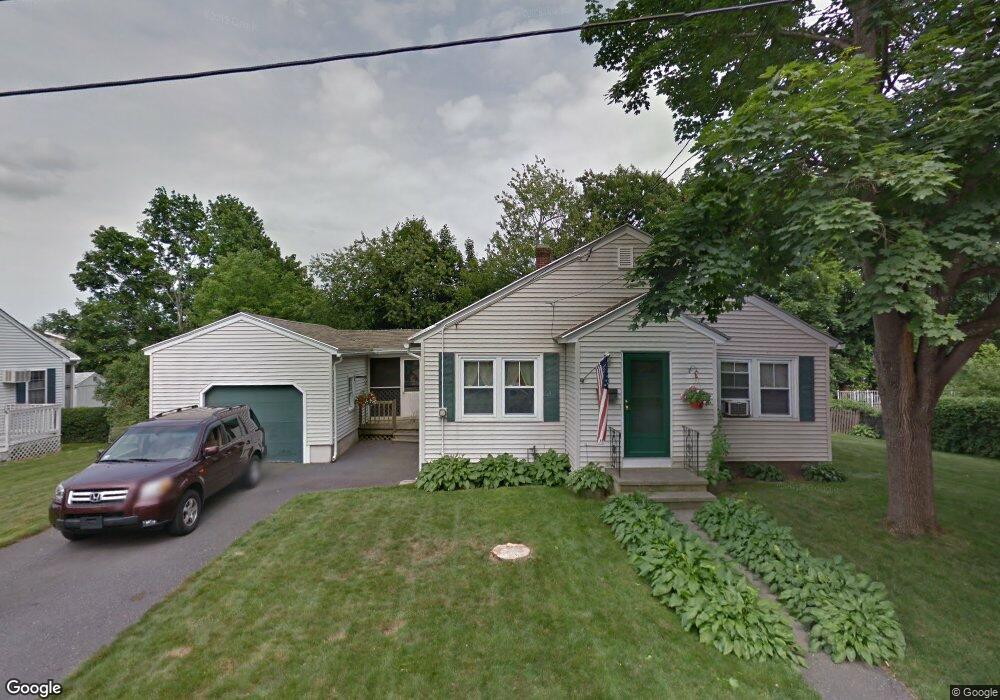
13 Maguire St Methuen, MA 01844
Downtown Methuen NeighborhoodEstimated Value: $469,000 - $561,193
3
Beds
1
Bath
1,776
Sq Ft
$293/Sq Ft
Est. Value
About This Home
This home is located at 13 Maguire St, Methuen, MA 01844 and is currently estimated at $519,548, approximately $292 per square foot. 13 Maguire St is a home located in Essex County with nearby schools including Mendota Elementary School, Tenney Grammar School, and South Point Elementary School.
Ownership History
Date
Name
Owned For
Owner Type
Purchase Details
Closed on
Apr 19, 2018
Sold by
Judith L Kiley Ret and Kiley
Bought by
Kiley Daniel P and Kiley Amita
Current Estimated Value
Home Financials for this Owner
Home Financials are based on the most recent Mortgage that was taken out on this home.
Original Mortgage
$177,000
Outstanding Balance
$151,633
Interest Rate
4.46%
Mortgage Type
New Conventional
Estimated Equity
$367,915
Purchase Details
Closed on
Jan 23, 2017
Sold by
Kiley Judith L
Bought by
Judith L Kiely Ret and Kiley
Purchase Details
Closed on
May 1, 1992
Sold by
Fed Natl Mtg Assn
Bought by
Kiley Daniel P
Create a Home Valuation Report for This Property
The Home Valuation Report is an in-depth analysis detailing your home's value as well as a comparison with similar homes in the area
Home Values in the Area
Average Home Value in this Area
Purchase History
| Date | Buyer | Sale Price | Title Company |
|---|---|---|---|
| Kiley Daniel P | $300,000 | -- | |
| Kiley Daniel P | $300,000 | -- | |
| Kiley Daniel P | $300,000 | -- | |
| Judith L Kiely Ret | -- | -- | |
| Judith L Kiely Ret | -- | -- | |
| Judith L Kiely Ret | -- | -- | |
| Kiley Daniel P | $103,000 | -- | |
| Kiley Daniel P | $103,000 | -- |
Source: Public Records
Mortgage History
| Date | Status | Borrower | Loan Amount |
|---|---|---|---|
| Open | Kiley Daniel P | $177,000 | |
| Closed | Kiley Daniel P | $177,000 | |
| Previous Owner | Kiley Daniel P | $90,000 | |
| Previous Owner | Kiley Daniel P | $8,500 |
Source: Public Records
Tax History Compared to Growth
Tax History
| Year | Tax Paid | Tax Assessment Tax Assessment Total Assessment is a certain percentage of the fair market value that is determined by local assessors to be the total taxable value of land and additions on the property. | Land | Improvement |
|---|---|---|---|---|
| 2025 | $4,796 | $453,300 | $201,300 | $252,000 |
| 2024 | $4,731 | $435,600 | $183,600 | $252,000 |
| 2023 | $4,487 | $383,500 | $163,200 | $220,300 |
| 2022 | $4,220 | $323,400 | $129,200 | $194,200 |
| 2021 | $3,952 | $299,600 | $122,400 | $177,200 |
| 2020 | $3,938 | $293,000 | $122,400 | $170,600 |
| 2019 | $3,762 | $265,100 | $115,600 | $149,500 |
| 2018 | $3,583 | $251,100 | $108,800 | $142,300 |
| 2017 | $3,468 | $236,700 | $108,800 | $127,900 |
| 2016 | $3,206 | $216,500 | $95,200 | $121,300 |
| 2015 | $3,100 | $212,300 | $95,200 | $117,100 |
Source: Public Records
Map
Nearby Homes
- 197 Oakland Ave
- 190-192 Oakland Ave
- 47 Lowell St
- 83 Arnold St
- 37 Maplewood Ave
- 17-19 Maplewood Ave
- 20-22 Ashland Ave
- 24 Railroad St
- 26 Gage St
- 52 High St Unit 5
- 32 Morrison Ct
- 2 Horne St
- 65 Clayton Ave
- 35 Hardy St
- 35 Memorial Dr
- 23 Chase St
- 220 Pelham St
- 69 Broadway
- 221 Pelham St
- 100-102 Phillips St