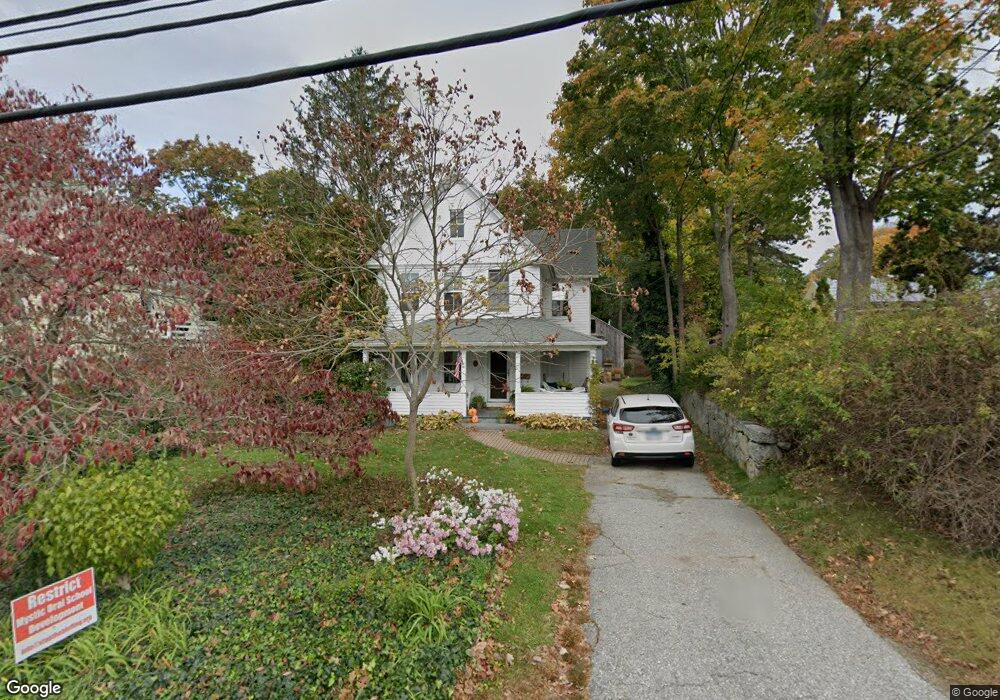
13 Main St Groton, CT 06340
Noank NeighborhoodEstimated Value: $502,696 - $846,000
2
Beds
1
Bath
1,344
Sq Ft
$554/Sq Ft
Est. Value
About This Home
This home is located at 13 Main St, Groton, CT 06340 and is currently estimated at $744,674, approximately $554 per square foot. 13 Main St is a home located in New London County with nearby schools including Groton Middle School and Robert E. Fitch High School.
Ownership History
Date
Name
Owned For
Owner Type
Purchase Details
Closed on
Dec 13, 2012
Sold by
Dyer Polly
Bought by
Stonington Irt and Dyer
Current Estimated Value
Purchase Details
Closed on
Dec 27, 2010
Sold by
Dyer Polly
Bought by
Stonington Irt and Dyer
Purchase Details
Closed on
Sep 22, 1999
Sold by
Audrieux Roxanne B and Estang Nancy D
Bought by
Waters Richard P and Cuthbert Mary
Purchase Details
Closed on
Sep 7, 1993
Sold by
Andrieux Roxanne
Bought by
Andrieux Roxanne and Destang Nancy
Create a Home Valuation Report for This Property
The Home Valuation Report is an in-depth analysis detailing your home's value as well as a comparison with similar homes in the area
Home Values in the Area
Average Home Value in this Area
Purchase History
| Date | Buyer | Sale Price | Title Company |
|---|---|---|---|
| Stonington Irt | -- | -- | |
| Stonington Irt | -- | -- | |
| Stonington Irt | -- | -- | |
| Stonington Irt | -- | -- | |
| Stonington Irt | -- | -- | |
| Stonington Irt | -- | -- | |
| Waters Richard P | $165,000 | -- | |
| Andrieux Roxanne | $60,000 | -- |
Source: Public Records
Mortgage History
| Date | Status | Borrower | Loan Amount |
|---|---|---|---|
| Previous Owner | Andrieux Roxanne | $196,000 | |
| Previous Owner | Andrieux Roxanne | $196,000 |
Source: Public Records
Tax History
| Year | Tax Paid | Tax Assessment Tax Assessment Total Assessment is a certain percentage of the fair market value that is determined by local assessors to be the total taxable value of land and additions on the property. | Land | Improvement |
|---|---|---|---|---|
| 2025 | $7,959 | $301,700 | $198,506 | $103,194 |
| 2024 | $7,431 | $301,700 | $198,506 | $103,194 |
| 2023 | $7,123 | $301,700 | $154,280 | $147,420 |
| 2022 | $6,978 | $301,700 | $154,280 | $147,420 |
| 2021 | $6,351 | $229,600 | $134,190 | $95,410 |
| 2020 | $6,188 | $229,600 | $134,190 | $95,410 |
| 2019 | $5,908 | $229,600 | $134,190 | $95,410 |
| 2018 | $5,869 | $229,600 | $134,190 | $95,410 |
| 2017 | $5,768 | $229,600 | $134,190 | $95,410 |
| 2016 | $5,697 | $245,350 | $159,600 | $85,750 |
| 2015 | $5,481 | $245,350 | $159,600 | $85,750 |
| 2014 | $5,341 | $245,350 | $159,600 | $85,750 |
Source: Public Records
Map
Nearby Homes
Your Personal Tour Guide
Ask me questions while you tour the home.