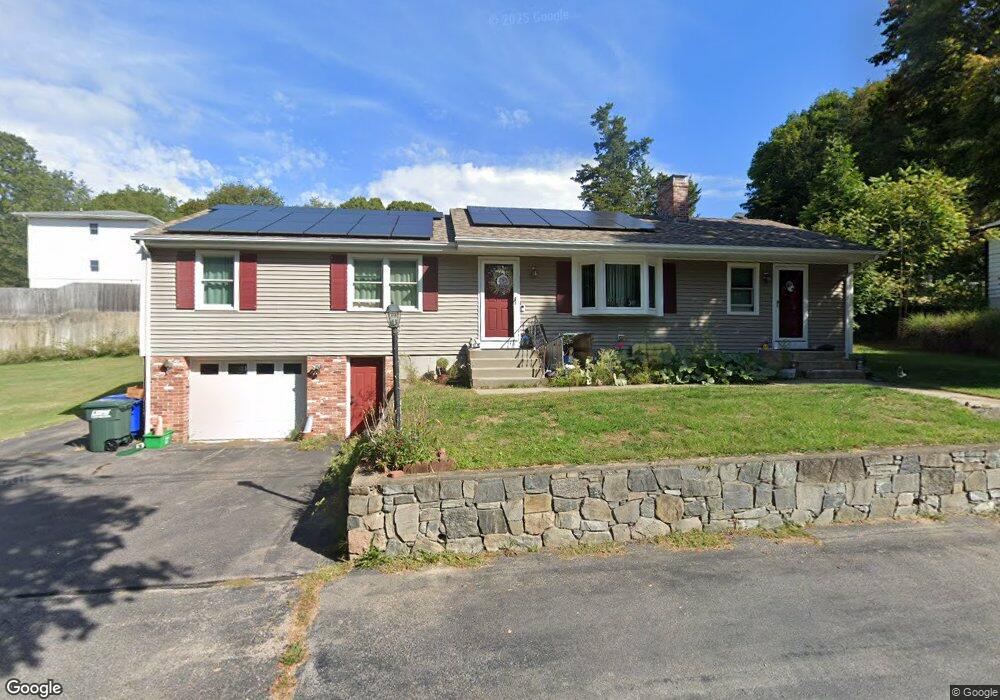
13 Manor Rd Pawcatuck, CT 06379
Estimated Value: $391,000 - $452,000
3
Beds
2
Baths
1,560
Sq Ft
$268/Sq Ft
Est. Value
About This Home
This home is located at 13 Manor Rd, Pawcatuck, CT 06379 and is currently estimated at $418,292, approximately $268 per square foot. 13 Manor Rd is a home located in New London County with nearby schools including Stonington Middle School, Stonington High School, and North Stonington Christian Academy.
Ownership History
Date
Name
Owned For
Owner Type
Purchase Details
Closed on
May 12, 1994
Sold by
Jones Calvin Lee and Jones Maryy T
Bought by
Cintron Daniel and Cintron Bobina
Current Estimated Value
Home Financials for this Owner
Home Financials are based on the most recent Mortgage that was taken out on this home.
Original Mortgage
$99,000
Interest Rate
5%
Mortgage Type
Unknown
Create a Home Valuation Report for This Property
The Home Valuation Report is an in-depth analysis detailing your home's value as well as a comparison with similar homes in the area
Home Values in the Area
Average Home Value in this Area
Purchase History
| Date | Buyer | Sale Price | Title Company |
|---|---|---|---|
| Cintron Daniel | $110,000 | -- | |
| Cintron Daniel | $110,000 | -- |
Source: Public Records
Mortgage History
| Date | Status | Borrower | Loan Amount |
|---|---|---|---|
| Open | Cintron Daniel | $5,758 | |
| Open | Cintron Daniel | $90,000 | |
| Closed | Cintron Daniel | $99,000 |
Source: Public Records
Tax History
| Year | Tax Paid | Tax Assessment Tax Assessment Total Assessment is a certain percentage of the fair market value that is determined by local assessors to be the total taxable value of land and additions on the property. | Land | Improvement |
|---|---|---|---|---|
| 2025 | $4,700 | $236,400 | $59,500 | $176,900 |
| 2024 | $4,503 | $236,400 | $59,500 | $176,900 |
| 2023 | $4,504 | $236,400 | $59,500 | $176,900 |
| 2022 | $3,947 | $154,100 | $49,100 | $105,000 |
| 2021 | $2,959 | $154,100 | $49,100 | $105,000 |
| 2020 | $3,877 | $154,100 | $49,100 | $105,000 |
| 2019 | $3,869 | $154,100 | $49,100 | $105,000 |
| 2018 | $2,733 | $140,400 | $49,100 | $91,300 |
| 2017 | $3,198 | $129,900 | $41,000 | $88,900 |
| 2016 | $3,111 | $129,900 | $41,000 | $88,900 |
| 2015 | $2,920 | $129,900 | $41,000 | $88,900 |
| 2014 | $2,857 | $129,900 | $41,000 | $88,900 |
Source: Public Records
Map
Nearby Homes
Your Personal Tour Guide
Ask me questions while you tour the home.