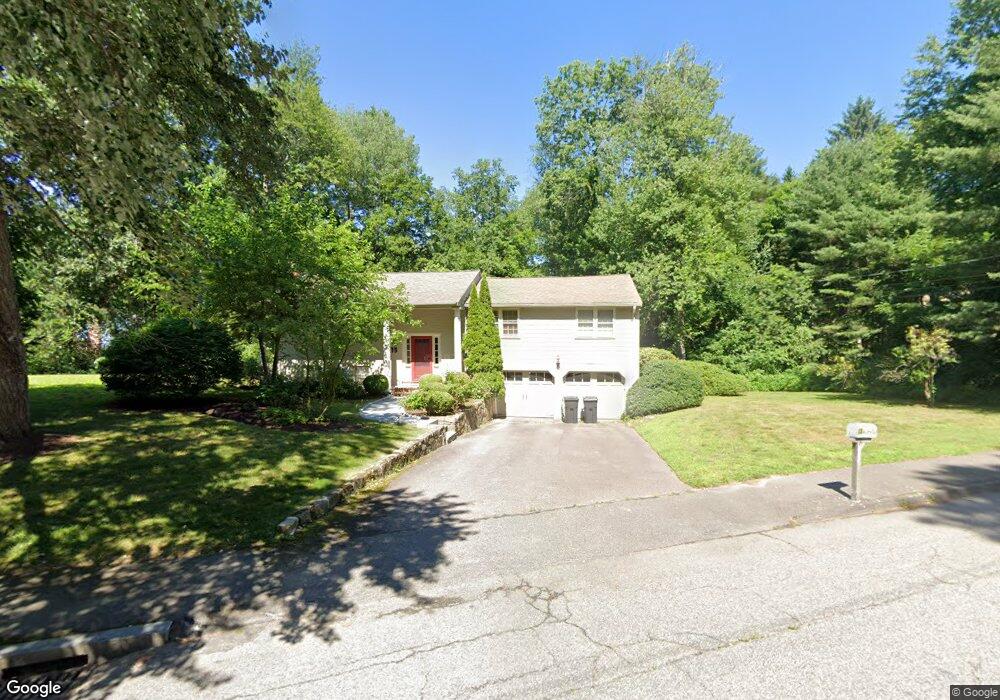
13 Maplewood Rd Medfield, MA 02052
Estimated Value: $1,013,306 - $1,136,000
4
Beds
3
Baths
2,290
Sq Ft
$464/Sq Ft
Est. Value
About This Home
This home is located at 13 Maplewood Rd, Medfield, MA 02052 and is currently estimated at $1,062,577, approximately $464 per square foot. 13 Maplewood Rd is a home located in Norfolk County with nearby schools including Memorial School, Ralph Wheelock School, and Dale Street School.
Ownership History
Date
Name
Owned For
Owner Type
Purchase Details
Closed on
Sep 27, 2011
Sold by
Cohen Lisa
Bought by
Edelglass Joshua and Edelglass Stephanie
Current Estimated Value
Home Financials for this Owner
Home Financials are based on the most recent Mortgage that was taken out on this home.
Original Mortgage
$412,850
Outstanding Balance
$282,634
Interest Rate
4.33%
Mortgage Type
Purchase Money Mortgage
Estimated Equity
$779,943
Purchase Details
Closed on
Oct 20, 2010
Sold by
Sharff David E and Sharff Lisa A
Bought by
Cohen-Sharff Lisa
Home Financials for this Owner
Home Financials are based on the most recent Mortgage that was taken out on this home.
Original Mortgage
$325,000
Interest Rate
4.37%
Mortgage Type
Purchase Money Mortgage
Purchase Details
Closed on
May 22, 1998
Sold by
Binder David and Binder Diane C
Bought by
Sharff David E and Sharff Lisa C
Purchase Details
Closed on
May 26, 1988
Sold by
Temming Michael
Bought by
Binder David
Create a Home Valuation Report for This Property
The Home Valuation Report is an in-depth analysis detailing your home's value as well as a comparison with similar homes in the area
Home Values in the Area
Average Home Value in this Area
Purchase History
| Date | Buyer | Sale Price | Title Company |
|---|---|---|---|
| Edelglass Joshua | $516,250 | -- | |
| Edelglass Joshua | $516,250 | -- | |
| Edelglass Joshua | $516,250 | -- | |
| Cohen-Sharff Lisa | -- | -- | |
| Cohen-Sharff Lisa | -- | -- | |
| Sharff David E | $270,000 | -- | |
| Sharff David E | $270,000 | -- | |
| Binder David | $257,000 | -- |
Source: Public Records
Mortgage History
| Date | Status | Borrower | Loan Amount |
|---|---|---|---|
| Open | Edelglass Joshua | $412,850 | |
| Closed | Edelglass Joshua | $412,850 | |
| Previous Owner | Cohen-Sharff Lisa | $325,000 |
Source: Public Records
Tax History Compared to Growth
Tax History
| Year | Tax Paid | Tax Assessment Tax Assessment Total Assessment is a certain percentage of the fair market value that is determined by local assessors to be the total taxable value of land and additions on the property. | Land | Improvement |
|---|---|---|---|---|
| 2025 | $11,236 | $814,200 | $483,300 | $330,900 |
| 2024 | $10,759 | $734,900 | $435,900 | $299,000 |
| 2023 | $10,597 | $686,800 | $417,000 | $269,800 |
| 2022 | $10,414 | $597,800 | $398,000 | $199,800 |
| 2021 | $10,159 | $572,000 | $394,200 | $177,800 |
| 2020 | $10,061 | $564,300 | $392,400 | $171,900 |
| 2019 | $9,655 | $540,300 | $375,300 | $165,000 |
| 2018 | $8,898 | $522,500 | $365,100 | $157,400 |
| 2017 | $9,048 | $535,700 | $360,100 | $175,600 |
| 2016 | $8,353 | $498,700 | $324,100 | $174,600 |
| 2015 | $7,715 | $481,000 | $320,100 | $160,900 |
| 2014 | $7,451 | $462,200 | $301,300 | $160,900 |
Source: Public Records
Map
Nearby Homes
- 21 Winter St
- 3 Shining Valley Cir
- 14 Harding St
- 8 Turtlebrook Way
- 46 Frairy St
- 435 Main St Unit B
- 431 Main St Unit 5
- 34 Frairy St
- 80 West St
- 40 Grand Hill Dr
- 2 Partridge Hill Rd
- 75 Bridge St
- 8 Hamlins Crossing
- 15 Belknap Rd
- 21 Philip St
- 144 Pine St
- 114 Farm St
- 9 Schaffner Ln
- 18 Tisdale Dr Unit 18
- 94 Elm St