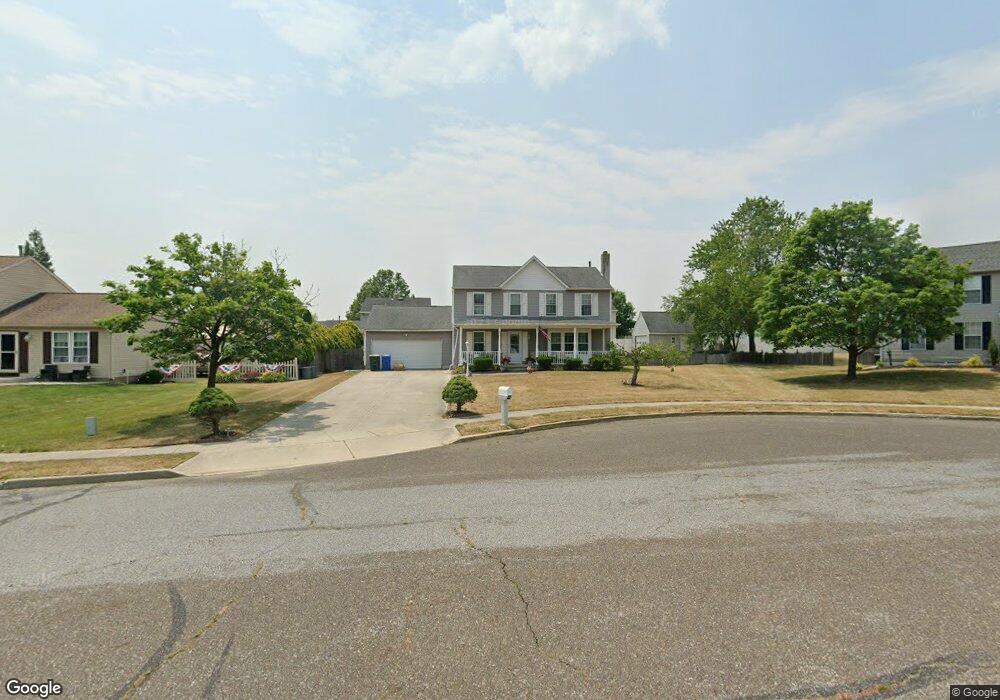
13 Marlowe Ct Glassboro, NJ 08028
Estimated Value: $404,252 - $468,000
--
Bed
--
Bath
1,920
Sq Ft
$228/Sq Ft
Est. Value
About This Home
This home is located at 13 Marlowe Ct, Glassboro, NJ 08028 and is currently estimated at $437,063, approximately $227 per square foot. 13 Marlowe Ct is a home located in Gloucester County with nearby schools including J Harvey Rodgers School, Dorothy L Bullock Elementary, and Glassboro Intermediate School.
Ownership History
Date
Name
Owned For
Owner Type
Purchase Details
Closed on
Apr 13, 2019
Sold by
Hadson Joseph Anthony and Hadson Lisa Anne
Bought by
Hodson Lisa Anne
Current Estimated Value
Purchase Details
Closed on
Jun 23, 1999
Sold by
Kociolak Michael and Kociolak Deanna
Bought by
Hodson Joseph A and Hodson Lisa A
Home Financials for this Owner
Home Financials are based on the most recent Mortgage that was taken out on this home.
Original Mortgage
$114,400
Outstanding Balance
$30,270
Interest Rate
7.09%
Estimated Equity
$406,793
Purchase Details
Closed on
Jan 31, 1994
Sold by
Page Mark
Bought by
Kocolak Michael and Kociolak Deanne
Home Financials for this Owner
Home Financials are based on the most recent Mortgage that was taken out on this home.
Original Mortgage
$110,000
Interest Rate
7.12%
Create a Home Valuation Report for This Property
The Home Valuation Report is an in-depth analysis detailing your home's value as well as a comparison with similar homes in the area
Home Values in the Area
Average Home Value in this Area
Purchase History
| Date | Buyer | Sale Price | Title Company |
|---|---|---|---|
| Hodson Lisa Anne | -- | None Available | |
| Hodson Joseph A | $143,000 | Fidelity National Title Ins | |
| Kocolak Michael | $142,000 | -- |
Source: Public Records
Mortgage History
| Date | Status | Borrower | Loan Amount |
|---|---|---|---|
| Open | Hodson Joseph A | $114,400 | |
| Previous Owner | Kocolak Michael | $110,000 |
Source: Public Records
Tax History Compared to Growth
Tax History
| Year | Tax Paid | Tax Assessment Tax Assessment Total Assessment is a certain percentage of the fair market value that is determined by local assessors to be the total taxable value of land and additions on the property. | Land | Improvement |
|---|---|---|---|---|
| 2025 | $8,849 | $251,400 | $70,600 | $180,800 |
| 2024 | $8,796 | $251,400 | $70,600 | $180,800 |
| 2023 | $8,796 | $251,400 | $70,600 | $180,800 |
| 2022 | $8,709 | $251,400 | $70,600 | $180,800 |
| 2021 | $8,850 | $251,400 | $70,600 | $180,800 |
| 2020 | $8,907 | $251,400 | $70,600 | $180,800 |
| 2019 | $8,922 | $251,400 | $70,600 | $180,800 |
| 2018 | $8,927 | $251,400 | $70,600 | $180,800 |
| 2017 | $8,970 | $251,400 | $70,600 | $180,800 |
| 2016 | $8,711 | $251,400 | $70,600 | $180,800 |
| 2015 | $8,522 | $251,400 | $70,600 | $180,800 |
| 2014 | $8,329 | $251,400 | $70,600 | $180,800 |
Source: Public Records
Map
Nearby Homes