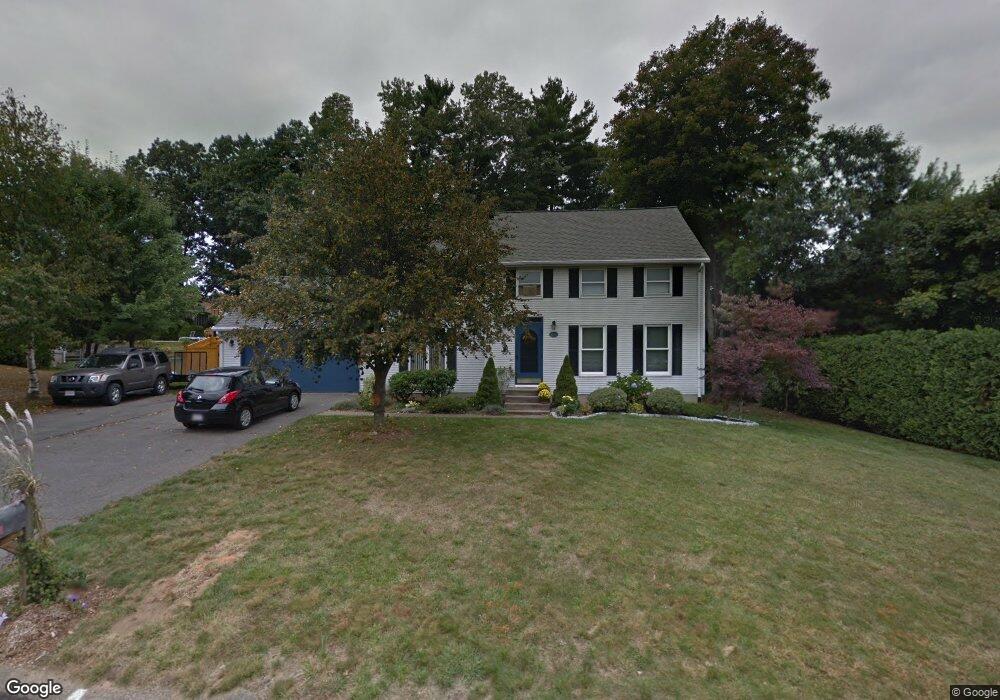
13 Matthew Dr Easthampton, MA 01027
Estimated Value: $541,460 - $591,000
4
Beds
4
Baths
1,972
Sq Ft
$284/Sq Ft
Est. Value
About This Home
This home is located at 13 Matthew Dr, Easthampton, MA 01027 and is currently estimated at $560,615, approximately $284 per square foot. 13 Matthew Dr is a home located in Hampshire County with nearby schools including Easthampton High School, Calvary Baptist Christian School, and Tri-County Schools.
Ownership History
Date
Name
Owned For
Owner Type
Purchase Details
Closed on
Sep 20, 2001
Sold by
Acquaro Nada and Acquaro Thomas J
Bought by
Mclane Dianne T and Mclane Timothy P
Current Estimated Value
Home Financials for this Owner
Home Financials are based on the most recent Mortgage that was taken out on this home.
Original Mortgage
$173,400
Interest Rate
6.98%
Mortgage Type
Purchase Money Mortgage
Purchase Details
Closed on
Aug 21, 1992
Sold by
Marshall William R and Marshall Patricia A
Bought by
Acquadro Thomas J and Acquadro Nada
Create a Home Valuation Report for This Property
The Home Valuation Report is an in-depth analysis detailing your home's value as well as a comparison with similar homes in the area
Home Values in the Area
Average Home Value in this Area
Purchase History
| Date | Buyer | Sale Price | Title Company |
|---|---|---|---|
| Mclane Dianne T | $204,000 | -- | |
| Acquadro Thomas J | $159,000 | -- |
Source: Public Records
Mortgage History
| Date | Status | Borrower | Loan Amount |
|---|---|---|---|
| Open | Acquadro Thomas J | $142,360 | |
| Closed | Acquadro Thomas J | $175,000 | |
| Closed | Acquadro Thomas J | $173,400 |
Source: Public Records
Tax History
| Year | Tax Paid | Tax Assessment Tax Assessment Total Assessment is a certain percentage of the fair market value that is determined by local assessors to be the total taxable value of land and additions on the property. | Land | Improvement |
|---|---|---|---|---|
| 2025 | $6,480 | $474,000 | $121,400 | $352,600 |
| 2024 | $6,273 | $462,600 | $117,900 | $344,700 |
| 2023 | $4,709 | $321,400 | $93,400 | $228,000 |
| 2022 | $5,313 | $321,400 | $93,400 | $228,000 |
| 2021 | $5,851 | $333,600 | $93,400 | $240,200 |
| 2020 | $5,708 | $321,400 | $93,400 | $228,000 |
| 2019 | $4,703 | $304,200 | $93,400 | $210,800 |
| 2018 | $4,525 | $282,800 | $88,000 | $194,800 |
| 2017 | $4,416 | $272,400 | $84,500 | $187,900 |
| 2016 | $4,247 | $272,400 | $84,500 | $187,900 |
| 2015 | $4,127 | $272,400 | $84,500 | $187,900 |
Source: Public Records
Map
Nearby Homes
Your Personal Tour Guide
Ask me questions while you tour the home.