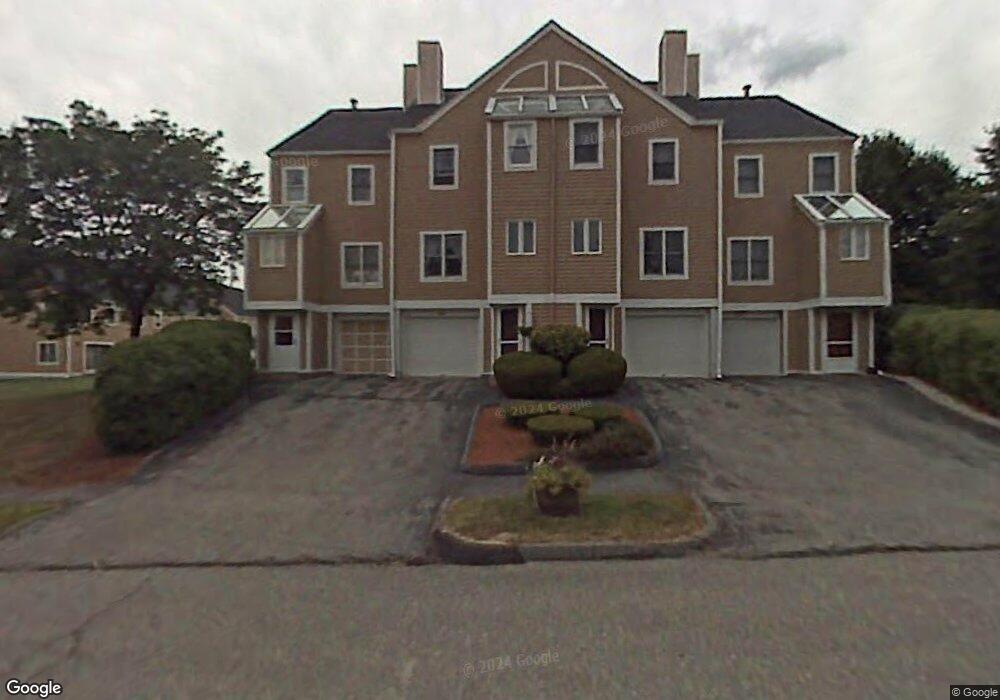
13 Merlin Ct Unit 25 Worcester, MA 01602
West Tatnuck NeighborhoodEstimated Value: $281,843 - $329,000
2
Beds
2
Baths
1,100
Sq Ft
$285/Sq Ft
Est. Value
About This Home
This home is located at 13 Merlin Ct Unit 25, Worcester, MA 01602 and is currently estimated at $313,961, approximately $285 per square foot. 13 Merlin Ct Unit 25 is a home located in Worcester County with nearby schools including Tatnuck Magnet School, Chandler Magnet, and Jacob Hiatt Magnet School.
Ownership History
Date
Name
Owned For
Owner Type
Purchase Details
Closed on
Mar 17, 2016
Sold by
Guetti Terri L
Bought by
E & V Realty Llc
Current Estimated Value
Home Financials for this Owner
Home Financials are based on the most recent Mortgage that was taken out on this home.
Original Mortgage
$116,250
Outstanding Balance
$92,225
Interest Rate
3.72%
Mortgage Type
New Conventional
Estimated Equity
$221,736
Purchase Details
Closed on
Jun 24, 2009
Sold by
Swigert Victoria L
Bought by
Guetti Terri L
Home Financials for this Owner
Home Financials are based on the most recent Mortgage that was taken out on this home.
Original Mortgage
$151,701
Interest Rate
4.92%
Mortgage Type
Purchase Money Mortgage
Purchase Details
Closed on
Sep 29, 1989
Sold by
Pojani Dennis
Bought by
Swigert Victoria
Home Financials for this Owner
Home Financials are based on the most recent Mortgage that was taken out on this home.
Original Mortgage
$94,900
Interest Rate
9.92%
Mortgage Type
Purchase Money Mortgage
Create a Home Valuation Report for This Property
The Home Valuation Report is an in-depth analysis detailing your home's value as well as a comparison with similar homes in the area
Home Values in the Area
Average Home Value in this Area
Purchase History
| Date | Buyer | Sale Price | Title Company |
|---|---|---|---|
| E & V Realty Llc | $155,000 | -- | |
| Guetti Terri L | $154,500 | -- | |
| Swigert Victoria | $105,000 | -- |
Source: Public Records
Mortgage History
| Date | Status | Borrower | Loan Amount |
|---|---|---|---|
| Open | E & V Realty Llc | $116,250 | |
| Previous Owner | Guetti Terri L | $151,701 | |
| Previous Owner | Swigert Victoria | $76,500 | |
| Previous Owner | Swigert Victoria | $94,900 |
Source: Public Records
Tax History Compared to Growth
Tax History
| Year | Tax Paid | Tax Assessment Tax Assessment Total Assessment is a certain percentage of the fair market value that is determined by local assessors to be the total taxable value of land and additions on the property. | Land | Improvement |
|---|---|---|---|---|
| 2025 | $3,464 | $262,600 | $0 | $262,600 |
| 2024 | $3,521 | $256,100 | $0 | $256,100 |
| 2023 | $3,347 | $233,400 | $0 | $233,400 |
| 2022 | $2,977 | $195,700 | $0 | $195,700 |
| 2021 | $3,020 | $185,500 | $0 | $185,500 |
| 2020 | $3,009 | $177,000 | $0 | $177,000 |
| 2019 | $3,082 | $171,200 | $0 | $171,200 |
| 2018 | $2,975 | $157,300 | $0 | $157,300 |
| 2017 | $2,898 | $150,800 | $0 | $150,800 |
| 2016 | $2,484 | $120,500 | $0 | $120,500 |
| 2015 | $2,418 | $120,500 | $0 | $120,500 |
| 2014 | $2,278 | $116,600 | $0 | $116,600 |
Source: Public Records
Map
Nearby Homes
- 12 Merlin Ct
- 40 Rustic Dr
- 1029 Pleasant St Unit 19
- 5 Forest Hill Dr
- 12 Copperfield Rd
- 806 Pleasant St
- 980 Pleasant St
- 33 Aylesbury Rd
- 148A Tory Fort Ln
- 12 Pinebrook Ln
- 22 Audubon Rd
- 32 Aylesbury Rd
- 66 Brigham Rd
- 3 Carter Way
- 7 Old Brook Dr
- 155 Tory Fort Ln
- 134 Richmond Ave
- 20 Manhattan Rd
- 57 Berwick St
- 28 Cascade Rd
- 11 Merlin Ct
- 13 Merlin Ct
- 35 Camelot Dr
- 37 Camelot Dr
- 39 Camelot Dr
- 41 Camelot Dr
- 57 Camelot Dr
- 55 Camelot Dr
- 53 Camelot Dr
- 51 Camelot Dr
- 49 Camelot Dr
- 47 Camelot Dr
- 43 Camelot Dr
- 47 Camelot Dr Unit 65,47
- 47 Camelot Dr Unit 47
- 47 Camelot Dr Unit 65
- 36 Camelot Dr
- 27 Camelot Dr
- 31 Camelot Dr
- 33 Camelot Dr