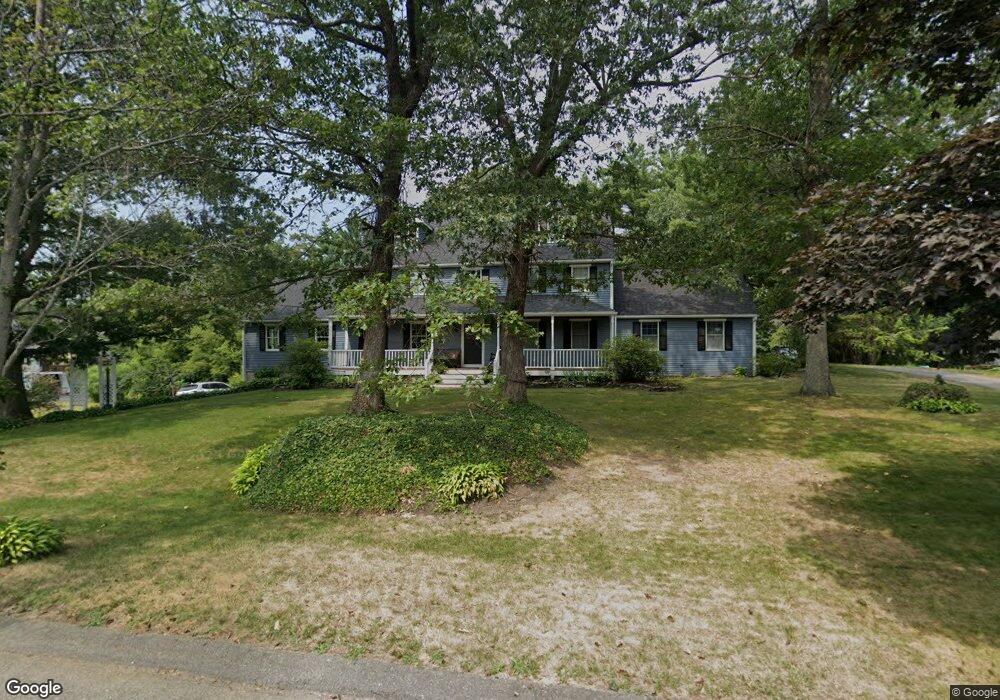
13 Morgan Dr Danvers, MA 01923
Estimated Value: $1,274,136 - $1,413,000
5
Beds
3
Baths
4,651
Sq Ft
$290/Sq Ft
Est. Value
About This Home
This home is located at 13 Morgan Dr, Danvers, MA 01923 and is currently estimated at $1,348,034, approximately $289 per square foot. 13 Morgan Dr is a home located in Essex County with nearby schools including Danvers High School, St. Mary of the Annunciation School, and Waldorf School at Moraine Farm.
Ownership History
Date
Name
Owned For
Owner Type
Purchase Details
Closed on
Nov 9, 2015
Sold by
Conway Ft and Conway
Bought by
Goff Patrick and Conway Aimee
Current Estimated Value
Home Financials for this Owner
Home Financials are based on the most recent Mortgage that was taken out on this home.
Original Mortgage
$400,000
Outstanding Balance
$302,224
Interest Rate
3%
Mortgage Type
New Conventional
Estimated Equity
$1,045,810
Purchase Details
Closed on
Oct 30, 2013
Sold by
Conway Francis R and Conway Patricia M
Bought by
Conway Rt and Conway
Home Financials for this Owner
Home Financials are based on the most recent Mortgage that was taken out on this home.
Original Mortgage
$100,000
Interest Rate
4.58%
Purchase Details
Closed on
Jul 28, 1994
Sold by
Caruso Rt Danvers and Caruso C
Bought by
Conway Francis and Conway Patricia
Create a Home Valuation Report for This Property
The Home Valuation Report is an in-depth analysis detailing your home's value as well as a comparison with similar homes in the area
Home Values in the Area
Average Home Value in this Area
Purchase History
| Date | Buyer | Sale Price | Title Company |
|---|---|---|---|
| Goff Patrick | $650,000 | -- | |
| Conway Rt | -- | -- | |
| Conway Francis | $135,000 | -- |
Source: Public Records
Mortgage History
| Date | Status | Borrower | Loan Amount |
|---|---|---|---|
| Open | Goff Patrick | $400,000 | |
| Previous Owner | Conway Francis | $100,000 |
Source: Public Records
Tax History
| Year | Tax Paid | Tax Assessment Tax Assessment Total Assessment is a certain percentage of the fair market value that is determined by local assessors to be the total taxable value of land and additions on the property. | Land | Improvement |
|---|---|---|---|---|
| 2025 | $12,215 | $1,111,500 | $428,600 | $682,900 |
| 2024 | $12,229 | $1,100,700 | $428,600 | $672,100 |
| 2023 | $12,041 | $1,024,800 | $398,200 | $626,600 |
| 2022 | $11,742 | $927,500 | $345,700 | $581,800 |
| 2021 | $11,066 | $828,900 | $318,000 | $510,900 |
| 2020 | $10,555 | $808,200 | $297,300 | $510,900 |
| 2019 | $10,535 | $793,300 | $297,300 | $496,000 |
| 2018 | $10,293 | $760,200 | $294,500 | $465,700 |
| 2017 | $9,902 | $697,800 | $262,700 | $435,100 |
| 2016 | $9,054 | $637,600 | $262,700 | $374,900 |
| 2015 | $8,886 | $596,000 | $242,000 | $354,000 |
Source: Public Records
Map
Nearby Homes
- 6 Colby Rd
- 4 Chatham Ln
- 3 Conrad Cir
- 78 North St
- 10 Maple St
- 12 Tulane Rd
- 2 Iroquois Rd
- 5 Main Dr
- 19 Bridle Spur Ln
- 17 Topsfield Rd
- 55 Burley St
- 466 Newbury St Unit 20
- 2 Chapel Rd
- 200 North St Unit 31A
- 11 Spring St
- 14 Grove St
- 35 Locust St Unit 3
- 244 Rowley Bridge Rd
- 22 Maple Ave
- 6 Venice St Unit B3
Your Personal Tour Guide
Ask me questions while you tour the home.